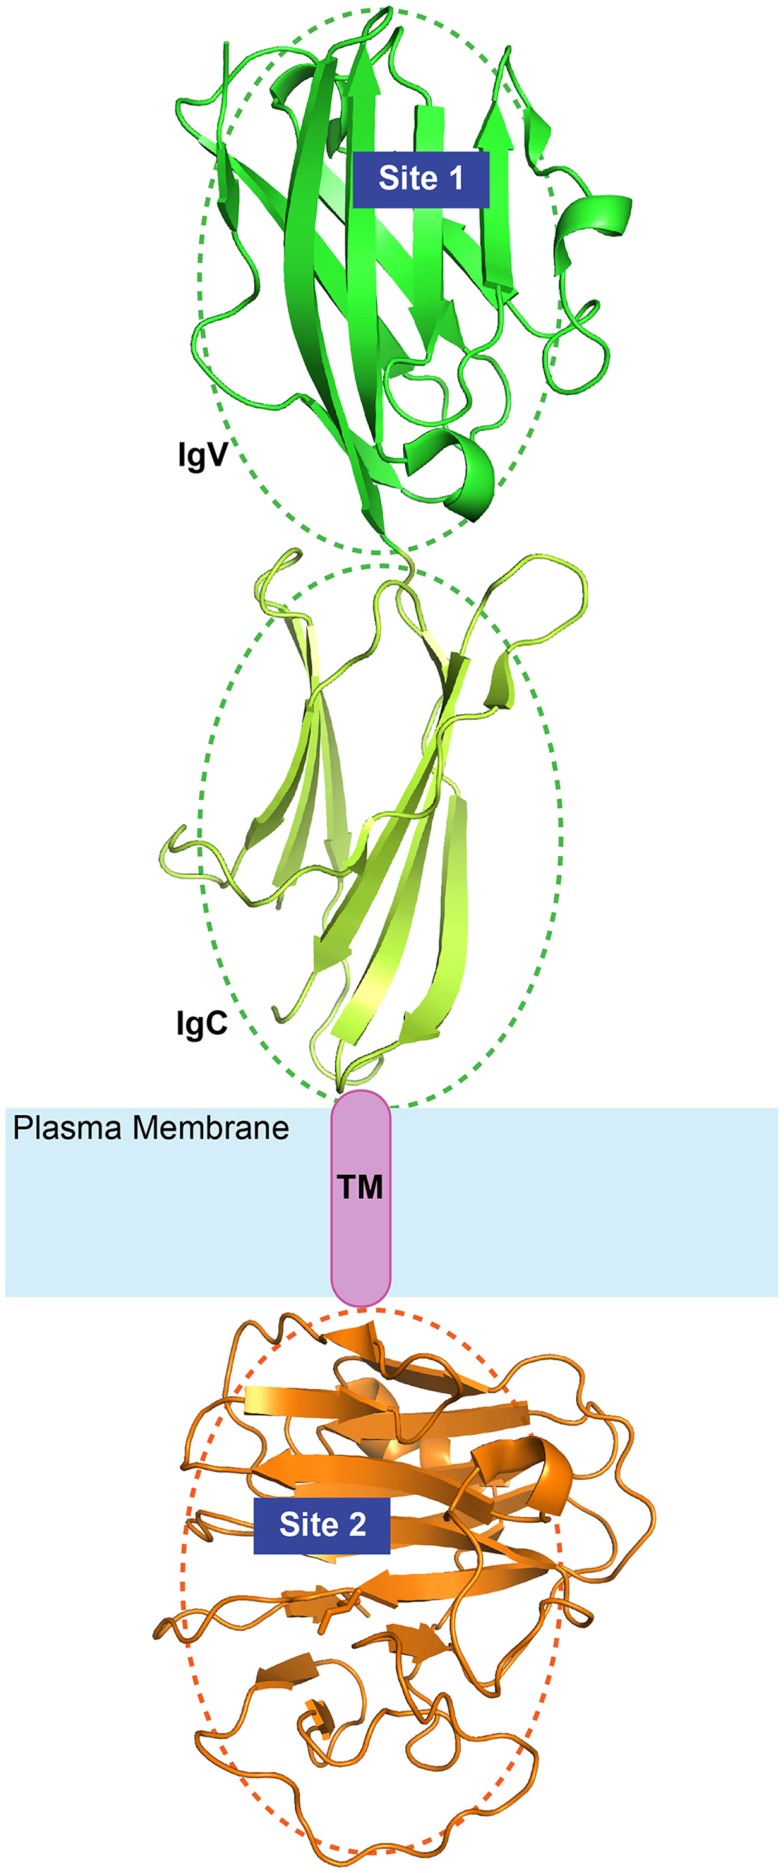
Figure 3.
Diagram of BTN3A1 topology. The extracellular Ig-like domains (green) and the intracellular B30.2 domains (orange) are illustrated here with available crystal structures (PDB IDs: 4F80 and 4N7U). The relative orientation of the domains is arbitrary as depicted by the dotted ovals. Site 1 and Site 2 represent the two identified binding sites of phosphoantigens.

