
Figure 2.
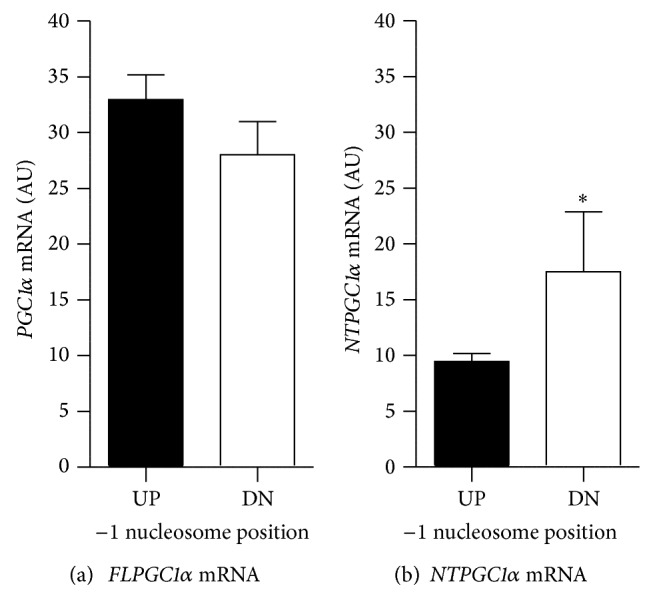
PGC1α gene expression. mRNA expression of FLPGC1α (a) and NTPGC1α (b) was measured by qRT-PCR in quadriceps muscle samples and mean ± SEM is shown as arbitrary units (AU) in upstream (UP, black) and downstream (DN, white) individuals. ∗ indicates significant difference between groups by Student's t-test with P < 0.05.