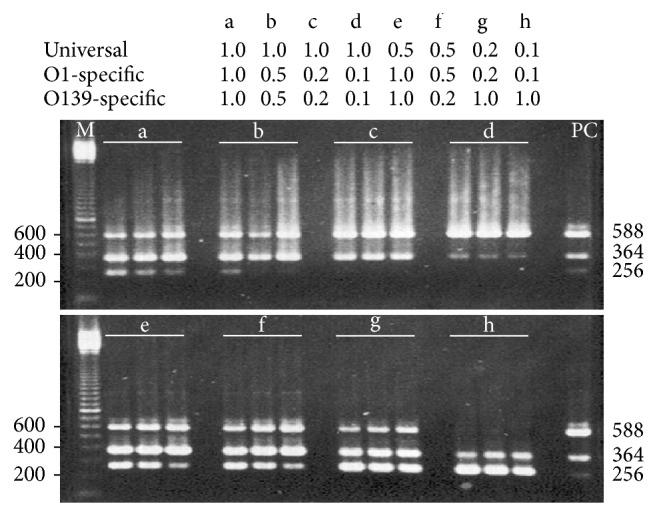
Figure 1.

Agarose gel electrophoresis analysis of the PCR algorithm upon annealing temperatures and primer set concentrations that had effects on yields of three specific amplicons. In a 25 μL PCR assay using 10 ng each of purified V. cholerae O1 and O139 gDNAs, amplification was performed in triplicate with varying concentration of three primer sets (μM) (a to h) and annealing temperature increments (°C) at 54.2, 55.5, and 56.9. The 100 bp molecular marker (lane M) and serogroup-specific PCR amplicons as positive control (lane PC) were used for base pair size comparisons.
