
Figure 2.
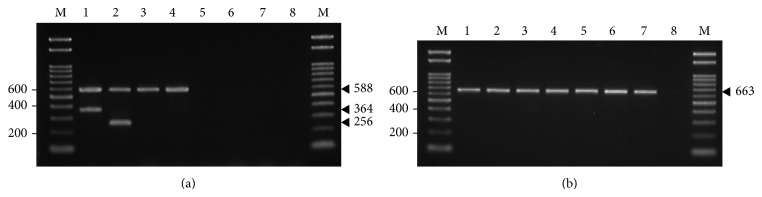
Agarose gel electrophoresis of the amplification specificity of optimized TMPCR (a) and 16S rDNA PCR (b), using representative target and nontarget gDNAs. In lanes 1 to 8, amplification reactions contained V. cholerae O1, V. cholerae O139, V. cholerae NAG I, V. cholerae NAG II, Vibrio parahaemolyticus, Vibrio vulnificus, Escherichia coli, and nuclease-free water, respectively. The expected sizes of specific amplicons (base pairs) were compared to the 100 bp standard ladder marker (lane M).