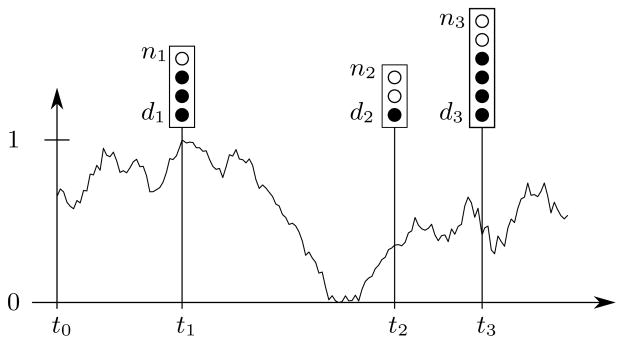
Fig 1.

In this example, samples of size n1 = 4, n2 = 3, and n3 = 6 (illustrated by the total number of circles) are taken at times t1, t2, and t3 respectively. The observed number of derived alleles (filled circles) is d1 = 3, d2 = 1, and d3 = 4. The initial time is t0, and the curve indicates a particular trajectory of the underlying population allele frequency Y(t) ∈ [0, 1].
