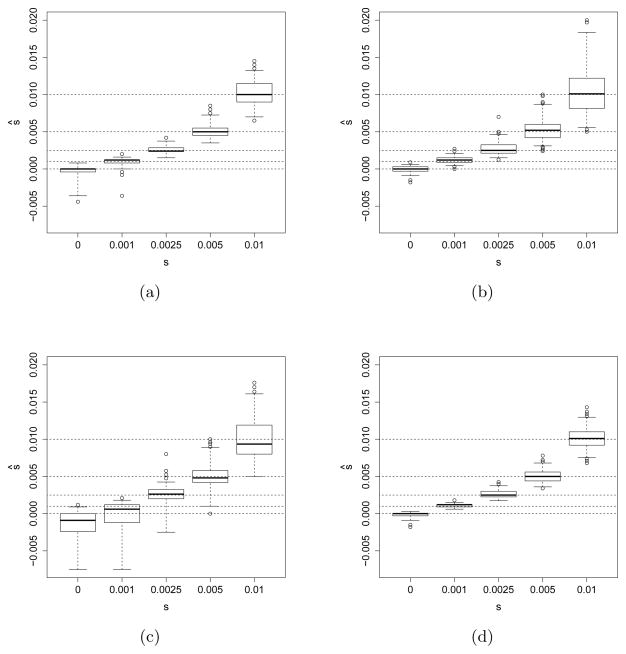
Fig 3.
Empirical distribution of the maximum likelihood estimates of 200 simulated datasets each under different modes of selection of differing strength with Ne = 10,000. The dashed lines indicate the true values of s. (a) Genic selection (s1 = s/2, s2 = s) with only five sampling time points. (b) Heterozygote advantage model of selection (s1 = s, s2 = 0) with ten sampling time points. (c) Recessive selection (s1 = 0, s2 = s) with ten sampling time points. (d) Dominant selection (s1 = s, s2 = s) with ten sampling time points.

