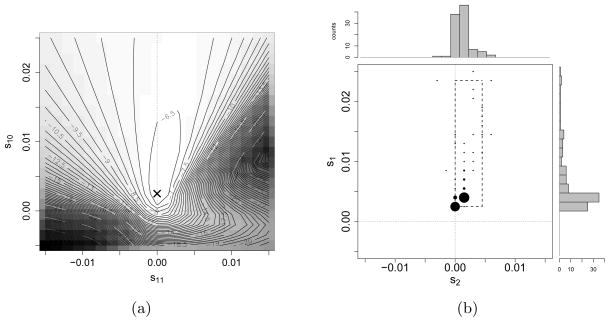
Fig 4.
Analysis of the ASIP locus. (a) Empirical values of the likelihood L(Θ) for temporal samples from the ASIP locus where the likelihood is computed over a 21 × 21 grid. The maximum is attained at (s1, s2) = (0.0025, 0), indicated by the ‘x’. (b) A joint density plot and marginal histograms of the maximum likelihood estimates for 100 bootstrap resampled datasets of the temporal data at the ASIP locus. The circles are centered on the grid points at which the likelihood function is evaluated, and the sizes of the circles indicate the proportion of maximum likelihood estimates that occupy the same grid point. The marginal empirical 2.5% and 97.5%-quantiles are [0.0025, 0.0235] for the heterozygote fitness s1, and [0, 0.0045] for the derived allele homozygote fitness s2, as indicated by the dashed box.

