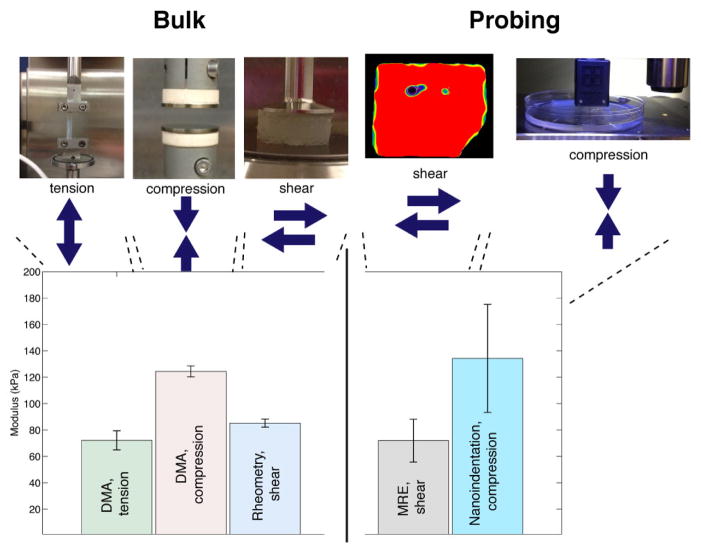
Figure 1.
Comparison of elastic stiffness of an agar hydrogel using five different material characterization methods: three bulk methods (left) and two localized methods (right). Due to the incompressible nature of most isotropic hydrated materials, such as hydrogels and tissues, their shear modulus (G) is approximately 1/3 of the tensile or compressive modulus (E) [E=2*G*(1+nu)]; the conversion of the measured G to E is shown for easier comparison. Results are displayed for an agar gel at 2.25 wt% and averaged across a broad frequency range (1–100 Hz). Error bars displayed represent standard deviations. MRE results on the agar gel are taken from the gel phantoms used in the in vitro experiments (see also Fig. 2) and are visualized as the red portion of the image above. Nanoindentation results were corrected for tip adhesion effects using a Johnson, Kendall and Roberts model (JKR model) (see Supplementary Information).

