Fig. 9.
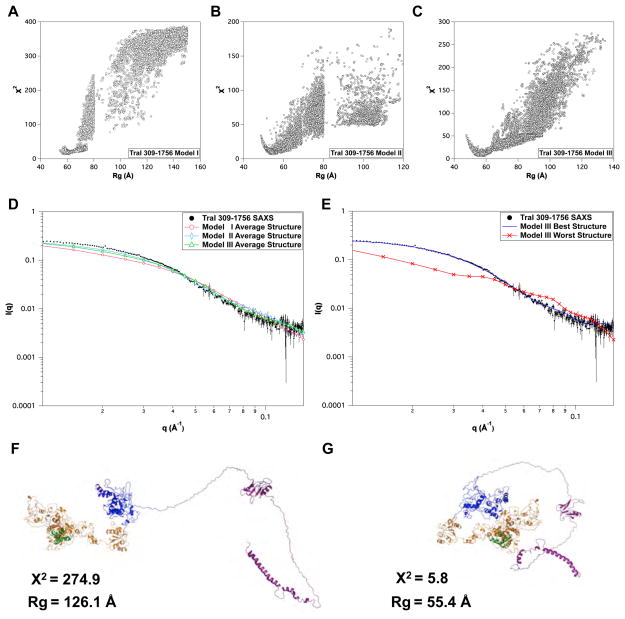
Comparison of MC simulations of TraI 309–1756. χ2 versus Rg plots for (A) Model I, (B) Model II and (C) Model III. (D) The overlay of experimental SAXS data and the average theoretical scattering profiles for the MMC ensembles derived for Models I–III. (E) Overlay of experimental data and theoretical scattering profiles of the best and worst structures, as judged by χ2, for Model III. (F) and (G) are the cartoon representations of the best and worst Model III structures, respectively. Error bars in D & E represent ± 1 standard deviation.

