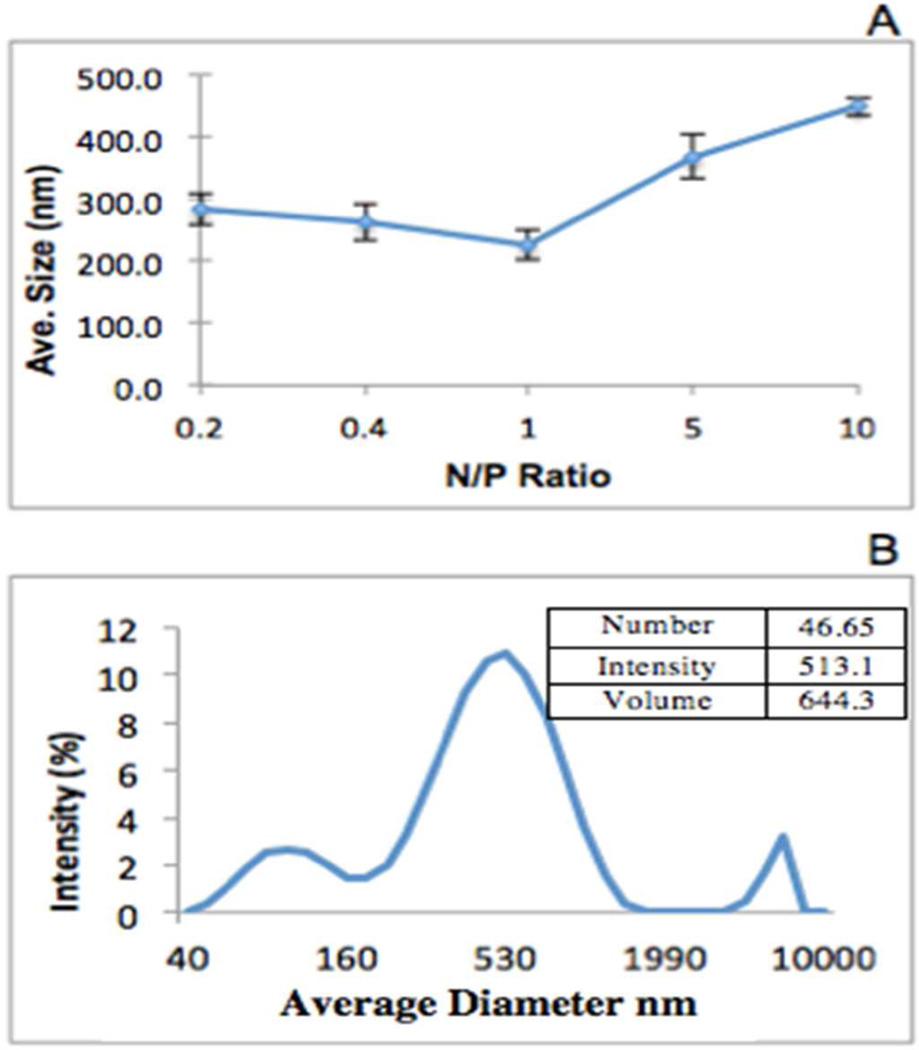
Figure 3.
Representative size measurements using DLS. (A) mPEG-PAMAM-G4 is complexed with RNA at various N/P ratios 0.2, 0.4, 1, 5, 10. (B) A representative average size peak of N/P ratio 10. Data is depicted as Intensity of size in nm. Inset table depicts average diameters using Number, Intensity, and Volume parameters. These are also shown in nm, and the prominent peak was chosen as the representative size.

