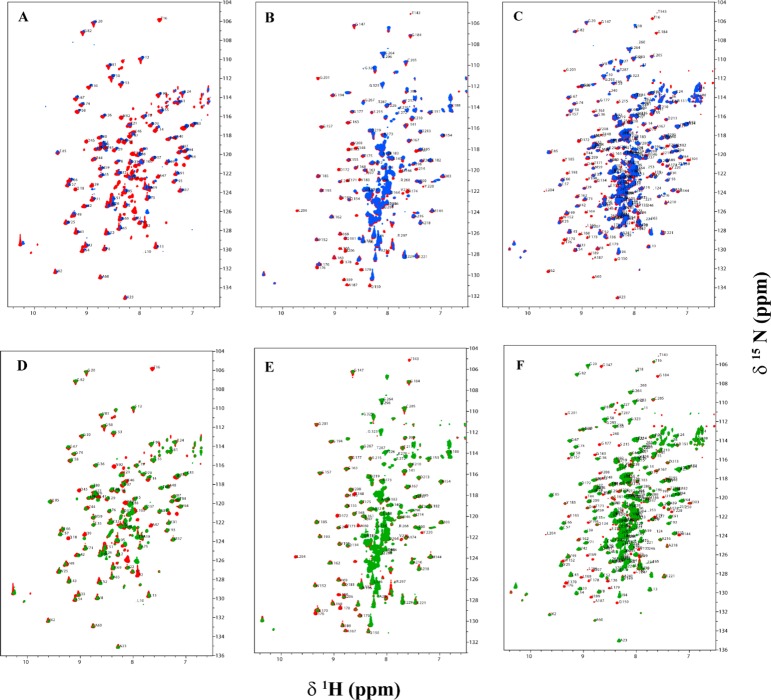
Figure 6.
Overlaid two-dimensional 15N–1H HSQC TROSY spectra of the C-terminally truncated E2-derived proteins L1, L2S, and L1L2S in the absence (red peaks) and presence of PDK1 (blue peaks) and PDK2 (green peaks). The C-terminally truncated E2-derived protein (0.3 mM) was mixed with unlabeled PDK1 (0.1 mM based on monomer) or PDK2 in 20 mM KH2PO4 (pH 7.0) containing 150 mM NaCl, 5% glycerol, and 10% D2O, and spectra were recorded at 25 °C. Spectra A–C represent interaction of L1, L2S, and L1L2S with PDK1, respectively, and spectra D–F represent interaction of L1, L2S, and L1L2S with PDK2, respectively. Assigned peaks are indicated with the one-letter amino acid code and residue number.

