
Figure 10.
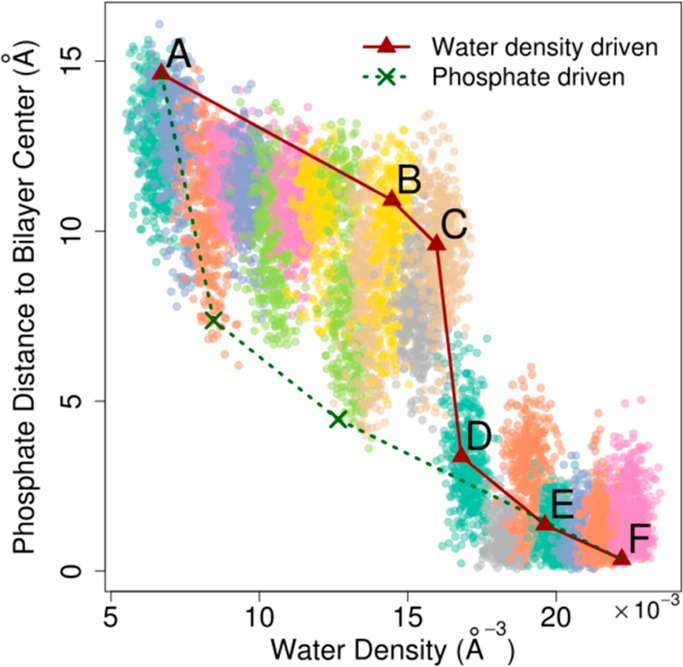
Average z coordinate of the two closest lipid phosphates from the bilayer center vs water density within pore cylinder illustrating different mechanisms between density-driven and phosphate-driven pore formation bias. Sampling from each umbrella is shown in different colors.