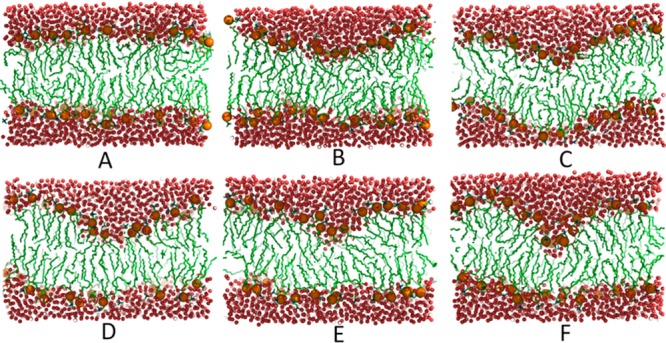
Figure 5.

Snapshots illustrating the one-sided deformation process from a flat bilayer state to a fully deformed state at water densities of 0.0016 (A), 0.0073 (B), 0.0111 (C), 0.0143 (D), 0.0167 (E), and 0.0170 Å–3 (F). Red spheres represent water molecules, brown spheres represent phosphorus atoms of the lipids, and lipid tails are shown in green.
