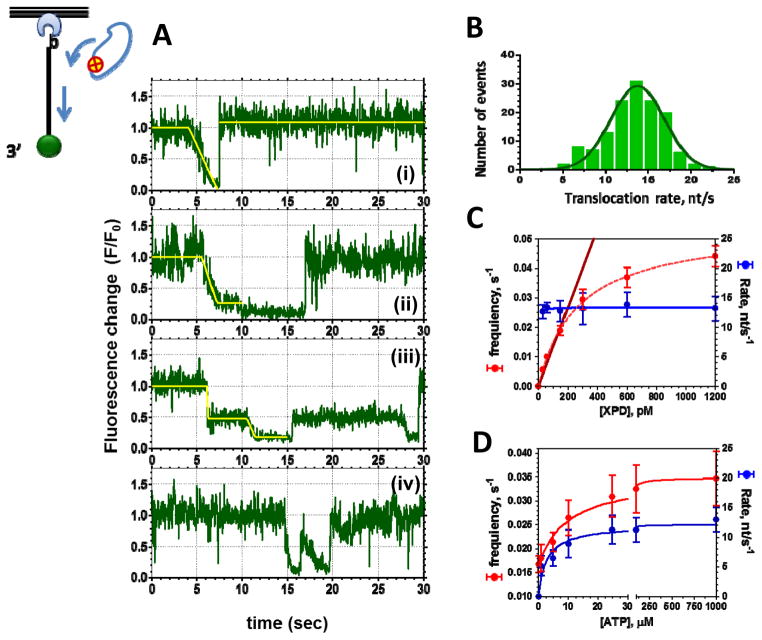
Figure 3. Analysis of XPD translocation trajectories.
A. Four distinct classes of unwinding events routinely observed in XPD translocation experiments. The top three classes could be fitted with multi-segment lines to determine the translocation rate. The fourth trajectory depicts two translocation events that occurred too close to one another to be analyzed. B. The rates of individual translocation events are binned and plotted as a histogram whose Gaussian fit yields average translocation rate. C. XPD concentration dependence of the frequency of the observed events and XPD translocation rates suggests that at the XPD concentrations below 200 nM we were observing translocation by individual XPD monomers. D. Both the translocation rate and the frequency of the observed events display Michaelis-Menten dependence on ATP concentration. The data shown were adapted from [54].

