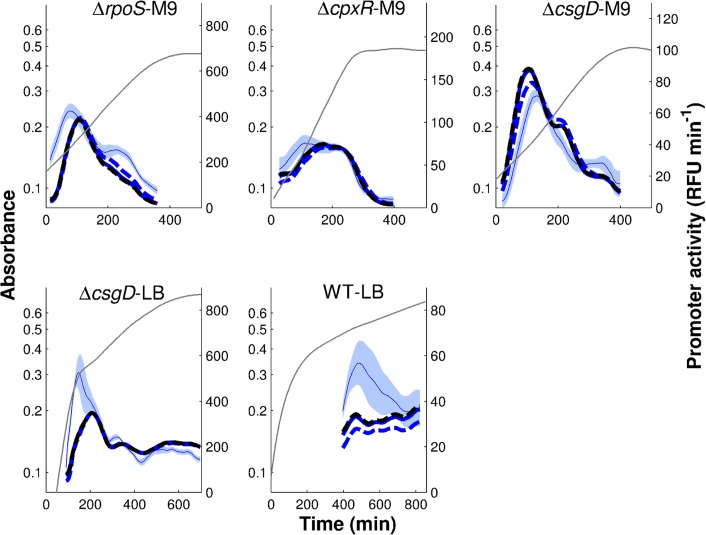
Figure 10. Regulation function of tar fitted to reporter gene data when reconstructing protein concentrations from the reporter gene data and including global physiological effects.
The regulation function of Eqs. 2–3 was fit to the data using the promoter activity for tar (Fig. 3), concentrations of FliA and FlgM reconstructed from the activities of their promoters for physiologically realistic half-lives (Fig. 9 and Text S7), and the activity of the constitutively expressed pRM promoter quantifying global physiological effects (Fig. 7). Model predictions are in thick black and blue lines, tar reporter data are in light blue (thin line and shaded area). Three fits are shown: the best fit for measured half-lives of FliA and FlgM of 30 min and 18 min, respectively (thick, blue solid line, Q = 25.5, (k 0, k 1, n, θ, K) = (0.26, 5.0, 1.99, 3542, 447499)) and two other fits for comparable half-lives (blue and black dashed lines). Parameter values were estimated using a multistart global optimization algorithm (see Methods and materials for details). Their confidence intervals are reported in Text S10.

