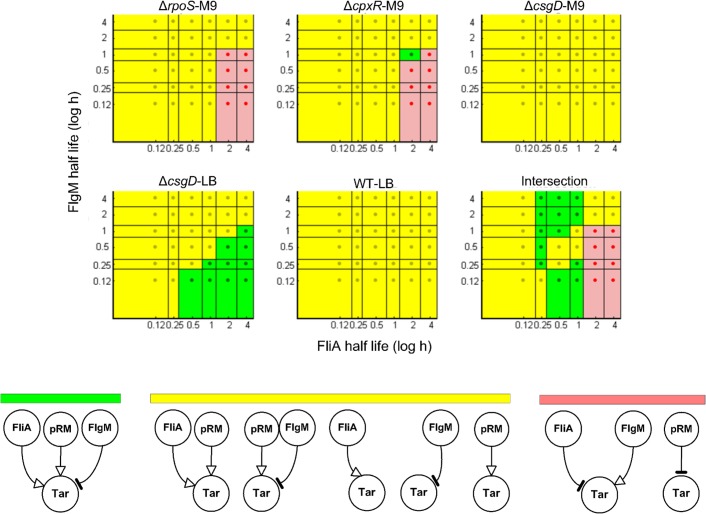
Figure 11. Minimal patterns of regulatory interactions for tar over a range of physiologically realistic half-lives.
The minimal regulatory patterns for the gene tar in the motility network of Fig. 6 as a function of the half-lives of FliA and FlgM. The plots correspond to the five experimental conditions considered (ΔrpoS-M9, ΔcpxR-M9, ΔcsgD-M9, ΔcsgD-LB, and WT-LB) as well as the pooling of the data sets from all five conditions. The dot in the center of each region in the plots corresponds to a tested combination of half-lives of FliA and FlgM, and thus to specific protein concentration profiles computed from the kinetic model of gene expression (Methods and materials). The minimal regulatory patterns were obtained by applying the minimal sign pattern algorithm [42]. The color codes represent the different categories of minimal signal patterns inferred. A region is colored green if the expected regulatory pattern is among the minimal sign patterns returned by the algorithm, and yellow if it is compatible with the returned sign patterns. A region is colored red if none of the returned sign patterns is consistent with the data only. Two examples of inconsistent sign patterns are shown. Note that, for every combination of half-lives, the analysis of the pooled data (results reported as “Intersection”) is generally more constraining than the pooling of the results from individual analyses: The expected pattern may be consistent (yellow) with all individual datasets but not minimal (green) for any of them, and turn out to be consistent and minimal (green) when all datasets are analyzed at once (see also Text S5).

