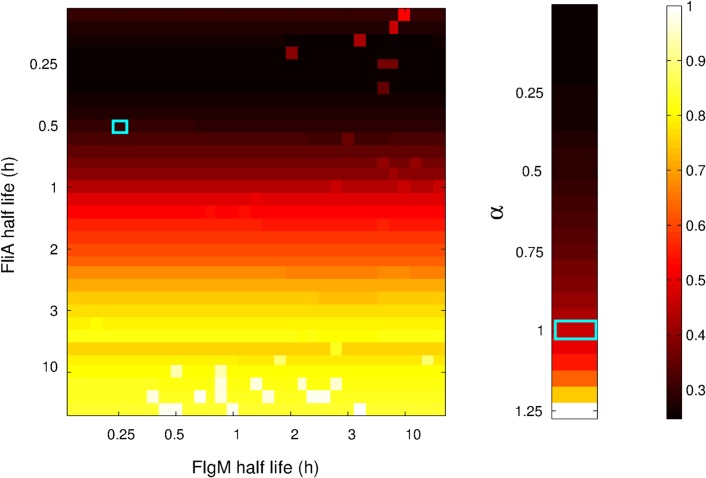
Figure 13. Heatmap of the fitting residuals for simulated data generated for different protein half-lives and for different strengths of global physiological effects.
A: For all different combinations of 33 half-lives of FlgM (horizontal axis) and FliA (vertical axis), the residual of the fit for a model ignoring protein kinetics is represented by the color code reported in the right bar. For clarity of presentation, the residual values Q have been normalized with respect to the maximum value of Q over all half-life combinations. The combination corresponding to the measured half-lives in LB medium is marked with a light blue square (18 min for FlgM, 30 min for FliA). B: For 26 different values of the strength parameter α, defined in Eq. 4, the residual of the fit by a model ignoring global physiological effects is represented by the color code. The residual values Q have been normalized with respect to the maximum value of Q over the different strengths of physiological effects. The value corresponding to the real data is marked with a light blue rectangle (α = 1).

