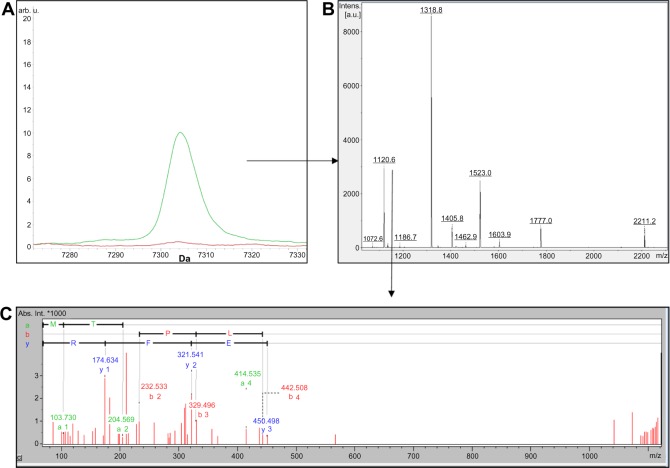
Figure 2.
(A) Comparison of MADLI-TOF mass spectra of C18 fractionated HAPD plasma showing the m/z 7304 peak analyzed by ClinproTools. The average spectra from CTRL (red) and FHS (green) groups represent the cumulative results of three pooled samples from nine birds. (B) Peptide mass fingerprint (PMF) of 7304 Da peptide. (C) Tandem mass spectrometry (MS/MS) of 1120 Da tryptic fragment derived from 7304 Da peptide.

