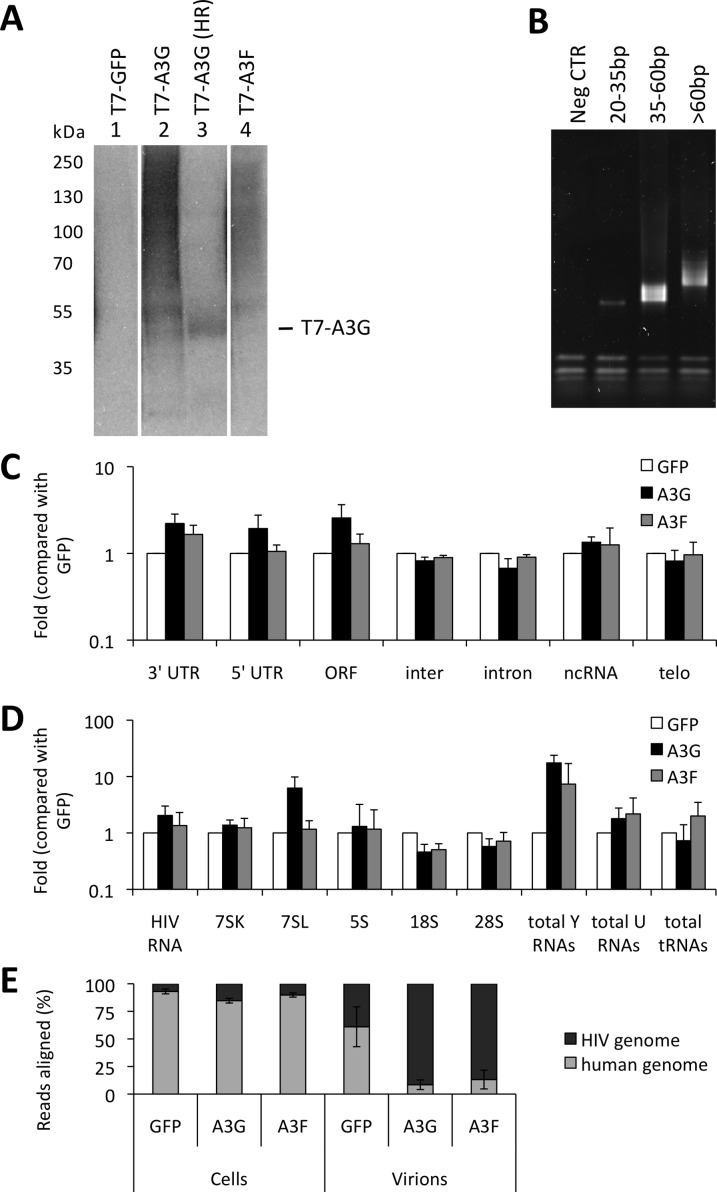
Figure 1. iCLIP reveals which RNAs are bound to A3G and A3F in living cells. (A).
CEM-SS T cells stably expressing GFP, GFP-tagged A3G or A3F, or T7-tagged GFP, A3G or A3F were infected with vif-deficient HIV-1IIIB. Cells were collected 48 h later, subjected to cross-linking with UV and lysed. A high concentration of RNase A was added to one sample (HR, lane 3) and a low concentration to the rest of the samples. Lysates were sonicated and the proteins of interest were immunoprecipitated with anti-GFP or anti-T7 antibodies bound to dynabeads. A linker was ligated to the nucleic acids, and these were radiolabeled with P32-ϒ-ATP. The samples were resolved by SDS-PAGE, and the RNA was visualised by autoradiography. A representative gel is shown. (B) RNAs running at a higher molecular mass than the proteins of interest were extracted from the membrane and reverse transcribed using a bar coded primer annealing to the previously ligated linker. The cDNAs were multiplexed and run on a TBE-urea gel. Bands ranging from 70–85, 85–110 and >110 base pairs (that contain 20–35, 35–60 and >60 bp of insert) were excised and the nucleic acids were isolated. The cDNAs were circularised, digested with BamHI and amplified by PCR. The product was then run on a gel to assess the quality of the library. A representative library is shown. The fractions that did not contain primer dimers of each library were mixed and sequenced. (C) Reads obtained from sequencing were aligned to the human genome. Only reads that aligned once with the possibility of 1 mismatch were considered for further analysis. Reads aligning to each gene were divided by the total number of reads in the library and the relation for each of the replicates was determined (r>0.9) and for each of the differently tagged proteins (r>0.9). The reads were then sorted into categories: 3’-UTR, 5’-UTR, open reading frame (ORF), intergenic regions (inter), intron, non-coding RNAs (ncRNA) and telomers (telo) and the values compared with the GFP negative control. The graph shows the average fold of 4 independent replicates obtained for A3G and A3F compared with GFP for each category of sequence and their respective standard deviations. (D) Reads were aligned to the HIV-1 genome as described for panel C. Repeat masker was used to align reads to specific genes that are found in viral particles. Reads aligning to Y1, Y3, Y4 and Y5 RNAs were added and considered as total Y RNAs. Similarly, we considered the same for U RNAs and tRNAs. The average fold compared to GFP of the 4 independent libraries was then plotted with standard deviations. (E) Reads obtained in the libraries of HIV-1-packaged A3G and A3F were aligned as described in panel C. The percentage of aligned reads to the human and HIV-1 genomes for the iCLIP performed with cells or virions was then calculated for each sample. Here, we show the average of the 4 independent replicates with standard deviations.

