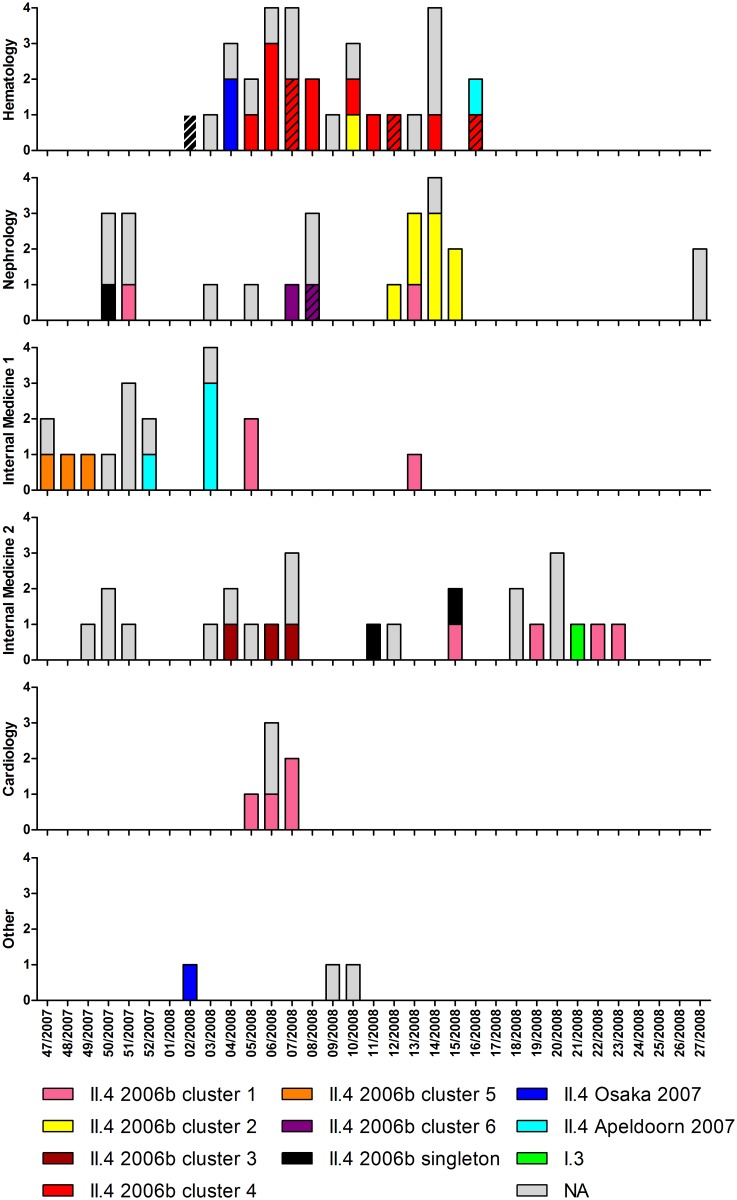
Figure 3. Local and temporal distribution of genotypes, variants and GII.4 2006b clusters.
The first sample per inpatient is shown (n = 105). Units on vertical axes represent numbers of patients. NA (n = 49): no sequence information available (n = 29: sample not stored, n = 20: GII.4 specific PCR negative). The sequences from the first samples from six patients with persistent diarrhea are marked with diagonal shading.

