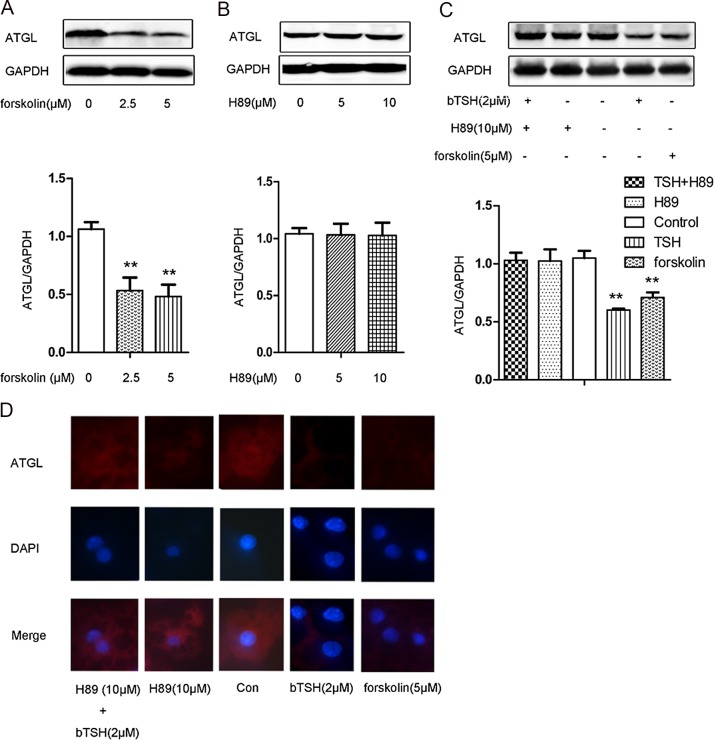
Figure 4. cAMP/PKA involved in TSH-induced downregulation of ATGL expression in differentiated 3T3-L1 cells.
(A) On D12, cells were treated with 2.5 μM forskolin, 5 μM forskolin, or vehicle, respectively, for 24 h in serum-free DMEM. (B) On D12, the cells were stimulated with 5 μM H89, 10 μM H89 or vehicle, respectively, for 24 h in serum-free DMEM. (C) On D12, the cells were stimulated with 5 μM forskolin, 10 μM H89 or 2 μM bTSH. After 1 h, the cells from one of the two dishes pretreated with 10 μmol/L H89 were exposed to 2 μM bTSH. All cells were treated for 24 h in serum-free DMEM. Proteins were separated by SDS-PAGE and immunoblotted for ATGL and GAPDH, as indicated. Representative Western blot results are shown. (D) The visualization of ATGL by immunofluorescence staining (red). Nuclei were stained with DAPI (blue). Values are reported as the fold change relative to the control group. The data are presented as the mean ± SD. ** p < 0.01 versus the control group. Original magnification: 400 ×.

