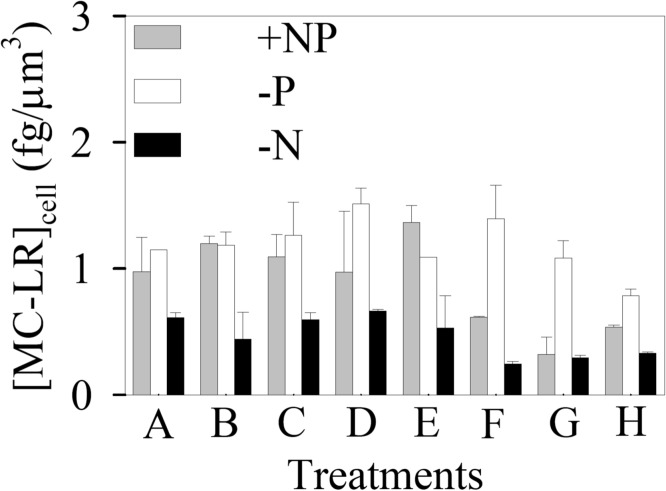
Figure 6. Cellular MC-LR concentration ([MC-LR]cell, fg/μm3) in treatments A-H of the nutrient-enriched (+NP), phosphorus-limited (-P), and nitrogen-limited (-N) toxicity tests for Microcystis aeruginosa PCC 7806 (WT). Cd concentration in treatments A-H ([Cd]T, 1.00×10⁻⁸—9.95×10⁻⁶ M; [Cd2+]F, 1.00×10⁻¹³—1.21×10⁻⁸ M) is listed in Table B of S1 File.
Data are mean ± standard error (n = 2)

