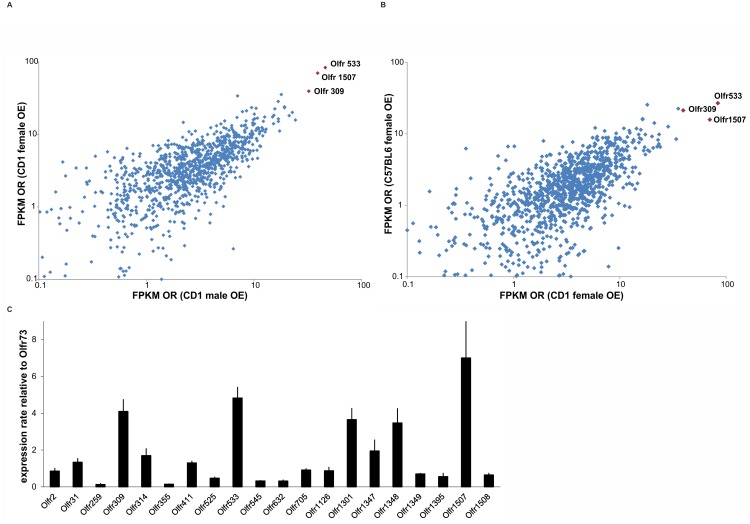
Figure 2. Correlations of expression levels plotted for each detected OR gene.
A. Correlation of the OR gene expression patterns between male and female CD1 mice. Only OR genes with detectable expression levels (FPKM>0.1) are shown. The FPKM values are logarithmically presented. The Pearson correlation coefficient of r = 0.83 confirmed the strong correlation of OR gene expression patterns between female and male CD1 mice. The three ORs (Olfr533, Olfr1507 and Olfr309) with the highest expression levels were also the most highly expressed in the RNA-Seq data from both sexes. B. Correlation of OR gene expression patterns between females of strain CD1 and C57BL6. The Pearson correlation coefficient of r = 0.75 confirmed the strong correlation between the expression patterns of OR genes between the different strains; however, these patterns exhibited greater divergence between strains than between the sexes of the CD1 strain. The most highly expressed ORs, Olfr533 and Olfr309, had the same expression ranking, and Olfr1507 was among the ten most highly expressed OR genes in both strains. C. Verification of RNA-Seq results for ORs by real time RT-PCR. Expression levels are relative to mOREG (Olfr73). Error bars represent the SEM.

