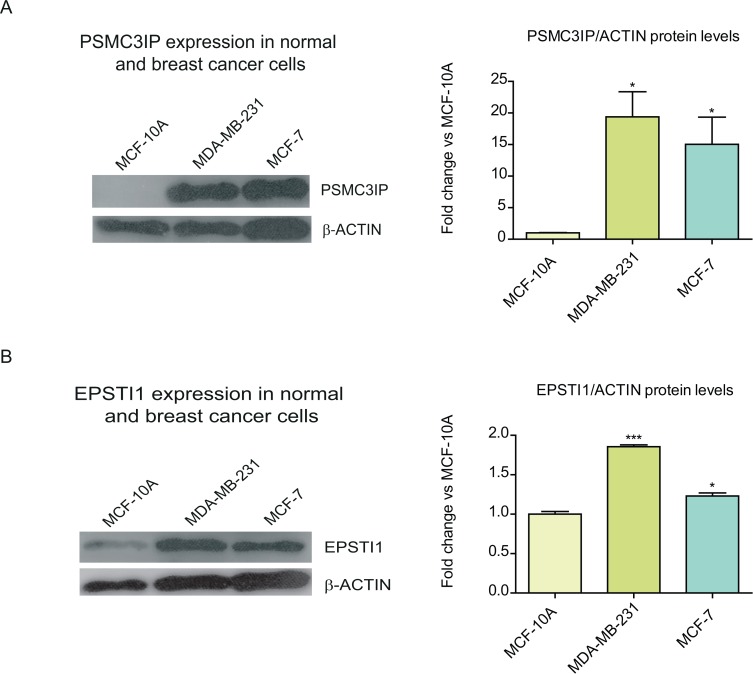
Figure 1. Expression of PSMC3IP and EPSTI1 in normal and breast cancer cell lines.
We inspected the endogenous expression of PSMC3IP (A) and EPSTI1 (B) in two types of breast cancer cell lines, MDA-MB-231 and MCF-7, as compared to a normal breast epithelial cell line, MCF-10A. Estimated protein levels based on densitometry (right) of the immunoblots (left) show a PSMC3IP 19- and 15-fold expression in MDA-MB-231 and MCF-7 cells, while EPSTI1 only shows 1.9- and 1.3-fold in each cell line, respectively. Protein levels were normalized based on the loading control protein β-actin. (*P <0.05, **P<0.01, ***P <0.001 vs MCF-10A cells).

