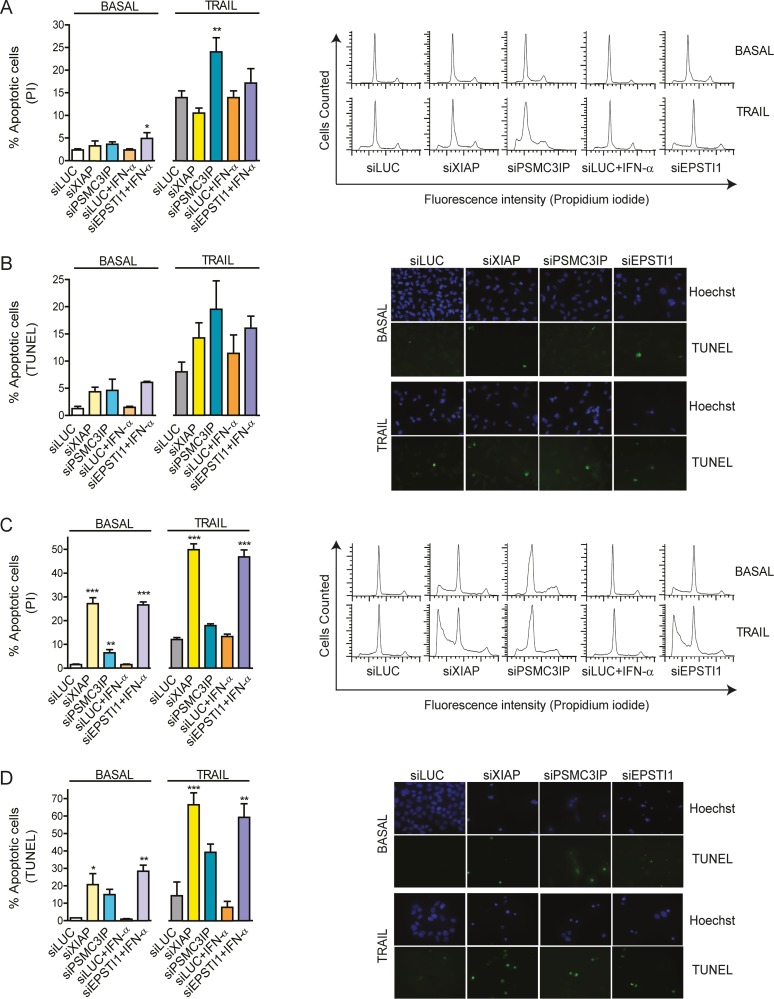
Figure 6. Detection of DNA fragmentation.
(A) The number of apoptotic MDA-MB-231 cells was quantified by flow cytometry using propidium iodide DNA staining after gene depletion under basal or TRAIL-treated conditions (i.e. measurement of the sub-G0/G1 peak in the fluorescence DNA histograms, right panels). (B) Apoptosis was also evaluated in MDA-MB-231 by the inspection of DNA fragmentation by TUNEL (fluorescein-12-dUTP labeled fragmented DNA) staining (right panels). Cell nuclei were stained with Hoechst (blue fluorescence) to estimate the number of total cells. (C) A similar analysis was carried out in MCF-7 cells. The measurement of the sub-G0/G1 peaks (right panels) indicates a significantly higher number of apoptotic gene-depleted cells even under basal conditions (left). (D) TUNEL positive nuclei displaying green fluorescence are observed under basal conditions (right), although a higher number is clearly observed under TRAIL-induced conditions (left). siLUC was used as a negative control, XIAP was used as an anti-apoptotic reference in all experiments. EPSTI1-depleted cells were previously treated with IFN-α at 1000 U/ml for 8h. In apoptosis-induced conditions, cells were treated with TRAIL for 24h, at 80 or 100ng/mL respectively. Each bar represents the mean ±SD of three experiments performed in duplicate (*P <0.05, **P <0.01, ***P <0.001 vs siLUC).

