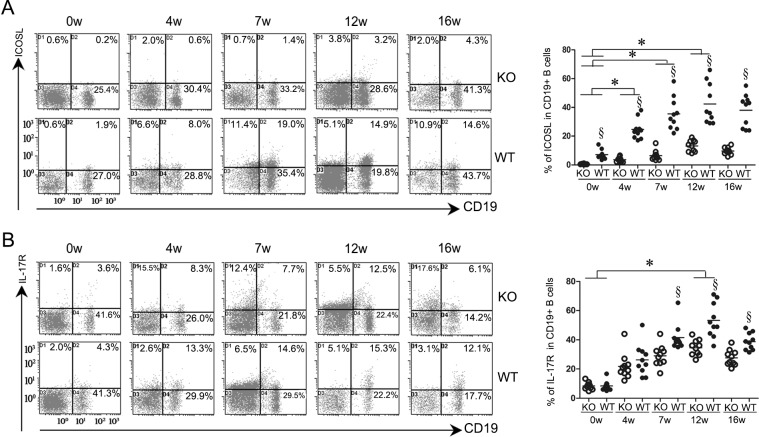
Figure 3. ICOSL KO mice infected with Schistosoma japonicum produced lower levels of ICOSL and IL-17R on CD19+ B cells than those of infected WT mice.
CD19+B cells isolated from the spleens were stained for CD19 and were then stained for ICOSL (A) and IL-17R(B) as described in the Materials and Methods. All density plot charts were based on 104 cells, satisfying a gate set on the forward versus side light scatter that defined spleen lymphocytes. Open symbols represent ICOS KO mice and closed symbols represent WT mice. Data shown are pooled from two independent experiments, symbols denotes individual mice and lines denote mean values. §Significant genotype effect and * significant time effect (P< 0.05, Tukey HSD, ANOVA performed using combined data from two separate experiments).

