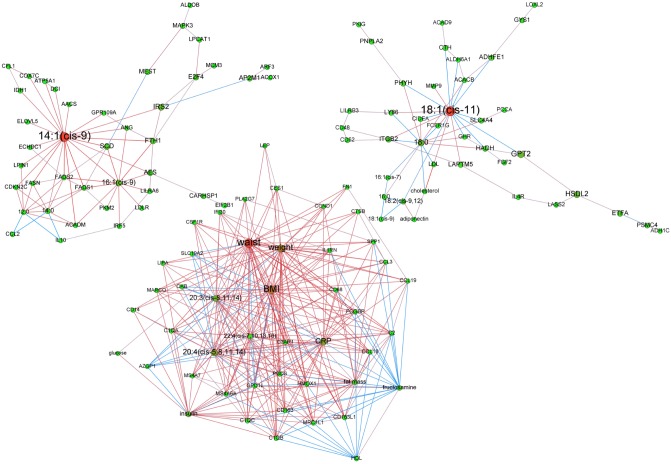
Figure 6. Adipose tissue networks during maintenance phase in women with continued weight loss.
A sparse Graphical Gaussian Model (GGM) was used to estimate partial correlations in each set of variables and regularized canonical correlation analysis (CCA) was used to assess links between paired sets of variable. Clustering was performed using a spin glass model and simulated annealing. This analysis displays the variables that are connected independently from other variables. Graphs were laid out using force-based algorithms in Gephi 0.8.2 software. Nodes’ colors and font size indicate betweenness centrality. The red nodes have the highest betweenness and the green nodes the lowest one. Edge thickness is proportional to the strength of the correlation (CCA) or of the partial correlation (GGM). Edge color indicates the correlation sign: red for positive correlations and blue for negative ones. BMI, body mass index; CRP, C reactive protein; DBP, diastolic blood pressure; HDL, high density lipoprotein; LDL, low density lipoprotein; SBP, systolic blood pressure; TG, plasma triglycerides; waist, waist circumference.

