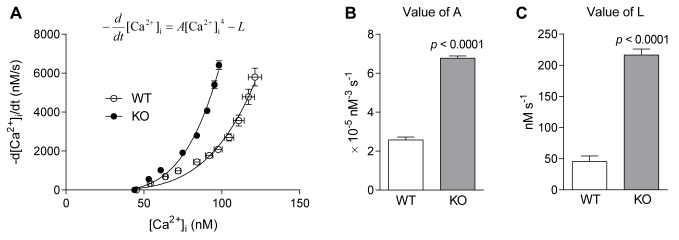
Figure 2. SR pump function in FDB fibres of WT and Actn3 KO mice.

A Relationship between [Ca2+]i and −d[Ca2+]i /dt (rate of [Ca2+]i decline) at selected time points during the slow phase of decay in twitch transients. Each point represents the mean ± S.E.M. across all twitch transients analysed in WT and KO fibres. The continuous lines are the SR pump function curves fitted to the points using the equation shown. B The parameter A, which reflects the rate of Ca2+ uptake by the SR pump, was significantly higher in fibres of KO mice. C The parameter L, which represents the rate of Ca2+ leak from the SR, was significantly higher in fibres of KO mice. (In all figures, n = 9 for WT and n = 9 for KO.)
