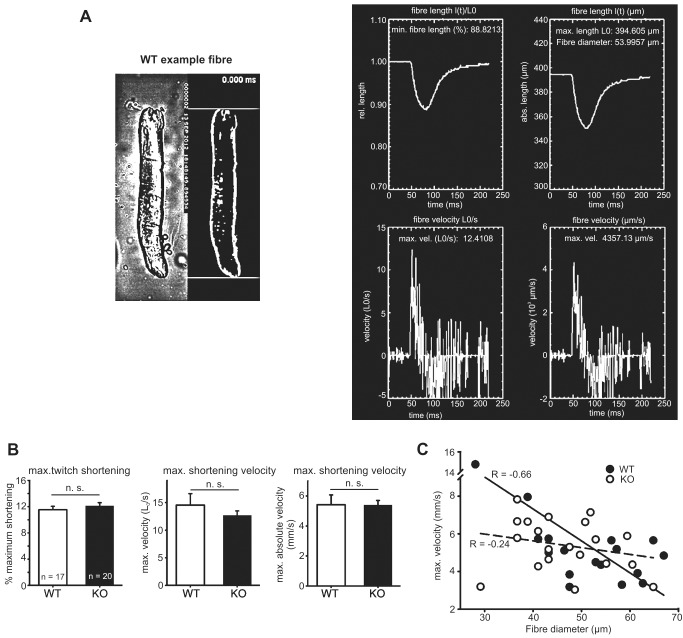
Figure 4. Speed of shortening in FDB fibres of WT and Actn3 KO mice.
A Image processing results in a representative WT FDB fibre recorded during electrical stimulation of a single twitch with a repetition frame rate of 422 μs (≈4.1 kfps). The left panel shows the original microscope image along with the processed segmented image for analysis of shortening parameters. The upper and lower border are visualised as straight lines in all images and can be easily followed during the online movie sequence for smoothness of shortening. The right panel shows the created output image containing the l(t), l(t)/L 0, vel(abs), vel(rel), fibre diameters and minimum shortening length calculated from the image processing algorithm. (Note that in the right panel, the text has been overtyped to improve legibility, as the original screenshot could not be obtained at a higher resolution.) B Biomechanical data for WT and Actn3 KO fibres showing maximum shortening during the twitch and maximum shortening velocities in 17 WT and 20 Actn3 KO fibres. C Velocity-diameter dependence of single fibres.

