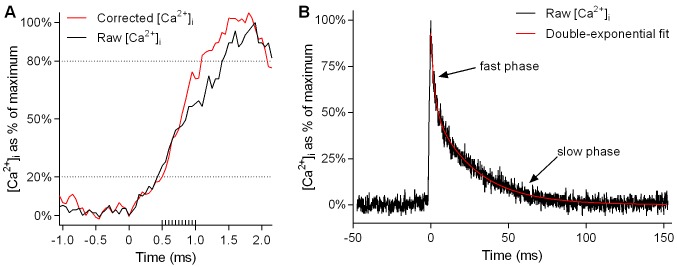
Figure 7. Kinetic correction of rise time and exponential fitting of twitch transient decay.
A and B show a sample Ca2+ transient elicited by a single action potential in a WT fibre (A, rising portion of transient only, on an expanded time scale; B, whole transient). In A, the black line shows [Ca2+]i as calculated from the raw fura-2 emission signal. The red line shows corrected [Ca2+]i as calculated using Eqn. 1 (see Methods) to account for the slow binding of fura-2. The dashed lines running horizontally across the graph indicate the 20% to 80% range over which rise times were calculated. In this particular instance, the time taken to rise from 20% to 80% of maximum [Ca2+]i is 40% lower in the corrected data than in the raw data. The extra gradations along the time axis indicate the frequency of sampling (20,000 Hz). In B, a double-exponential curve (red line) has been fitted to the decay phase of the Ca2+ transient (black line) using Eqn. 2 (see Methods).

