
Figure 1.
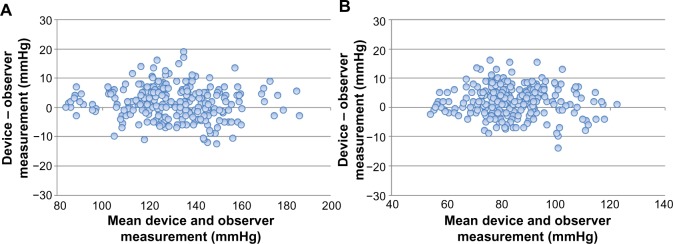
Bland–Altman plots for the differences between the Omron BP765 readings and the observer measurements for systolic blood pressure (A) and diastolic blood pressure (B).
Official websites use .gov
A
.gov website belongs to an official
government organization in the United States.
Secure .gov websites use HTTPS
A lock (
) or https:// means you've safely
connected to the .gov website. Share sensitive
information only on official, secure websites.
Bland–Altman plots for the differences between the Omron BP765 readings and the observer measurements for systolic blood pressure (A) and diastolic blood pressure (B).