Figure 2.

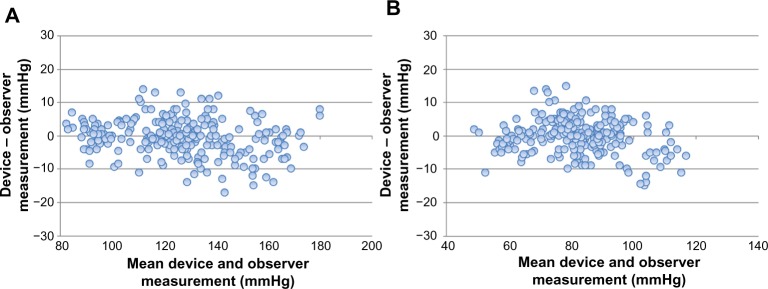
Bland–Altman plots for the differences between the Omron BP760N readings and the observer measurements for systolic blood pressure (A) and diastolic blood pressure (B).

Bland–Altman plots for the differences between the Omron BP760N readings and the observer measurements for systolic blood pressure (A) and diastolic blood pressure (B).