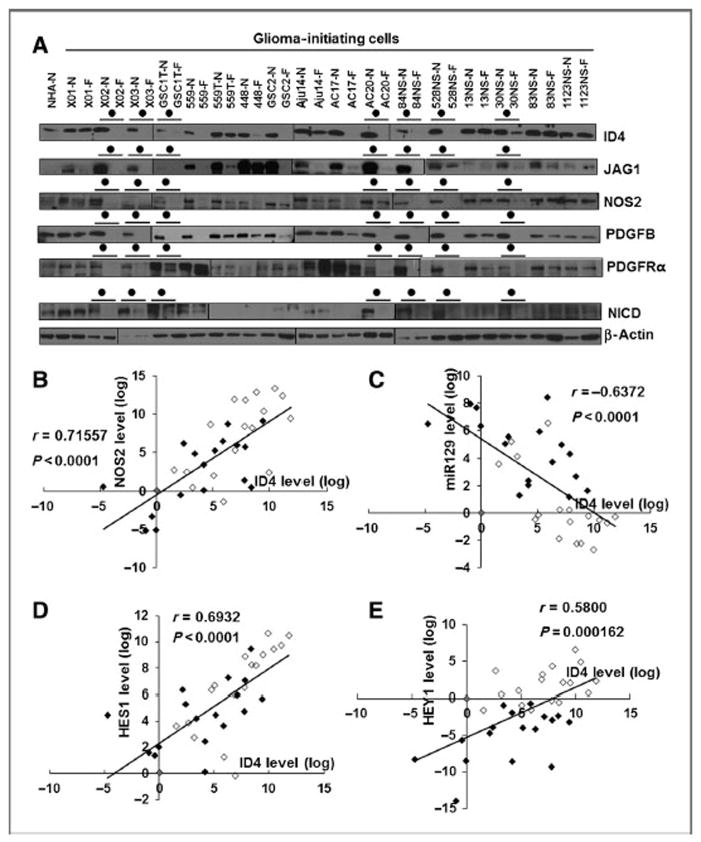
Figure 6.
Expression of genes involved in the PDGF–NOS–ID4–miR129 axis and JAGGED1–NOTCH signaling in human patient–derived GICs. A, comparison of ID4, JAGGED1, NOS2, PDGFB, PDGFRα, and NICD protein levels between 17 primary GICs grown under stem cell (N; NBE with EGF and bFGF) and differentiation (F; 5% FBS) culture conditions. The closed circle indicates GICs displaying decrease in protein expression tested by GIC differentiation. B–E, ID4 mRNA levels in 34 primary GICs grown in NBE (open, n = 17) and 5% FBS cultures (closed, n = 17) correlated with NOS2 (B), HES1 (D), and HEY1 (E) mRNA levels. C, ID4 inversely correlated with miR129 levels. A Pearson product–moment correlation coefficient (r) was used to analyze the linear correlation between two variables.

