Figure 3.
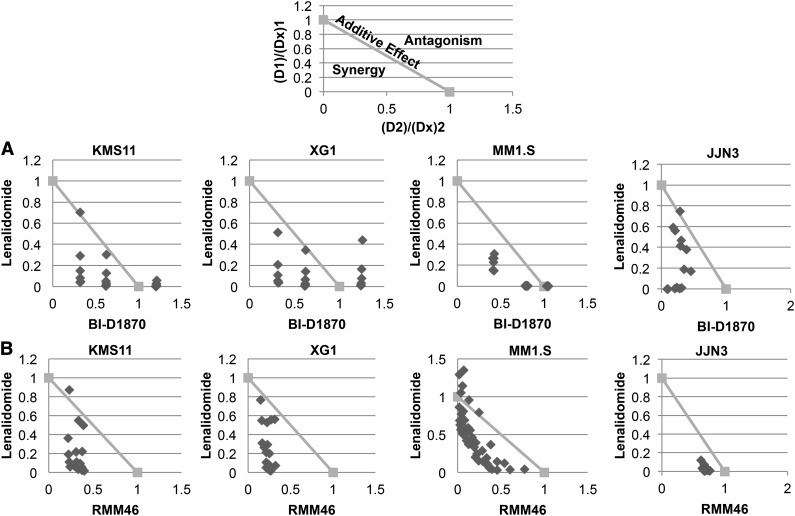
RSK2 inhibitor inhibited myeloma cell growth and synergized with lenalidomide to induce cytoxicity of myeloma cells. Four HMCLs (KMS11, XG1, MM1.S, and JJN3) were treated with various doses of lenalidomide (Len, μM) and (A) BI-D1870 (BI, μM) or (B) RMM46 (RM, μM) for 6 days, followed by MTT assay to measure cell viability. The data from each treatment were normalized to vehicle-treated control and then analyzed using CalcuSyn software to generate normalized isobolograms. An example of a normalized isobologram with the ranges indicative of synergy, additive effects, and antagonism has been provided above the experimental data. The normalized isobolograms below depict the combinations of lenalidomide (D1), BI-1870 or RMM46 (D2), and the effect of the drug observed at the corresponding dose (D × 1, D × 2). Any data points falling below the line have a combination index <1 and are synergistic. Data points on or above the line are considered additive or antagonistic, respectively. Each point on the normalized isobologram corresponds to a specific combination of lenalidomide and BI-D1870/RMM46.

