Figure 3.
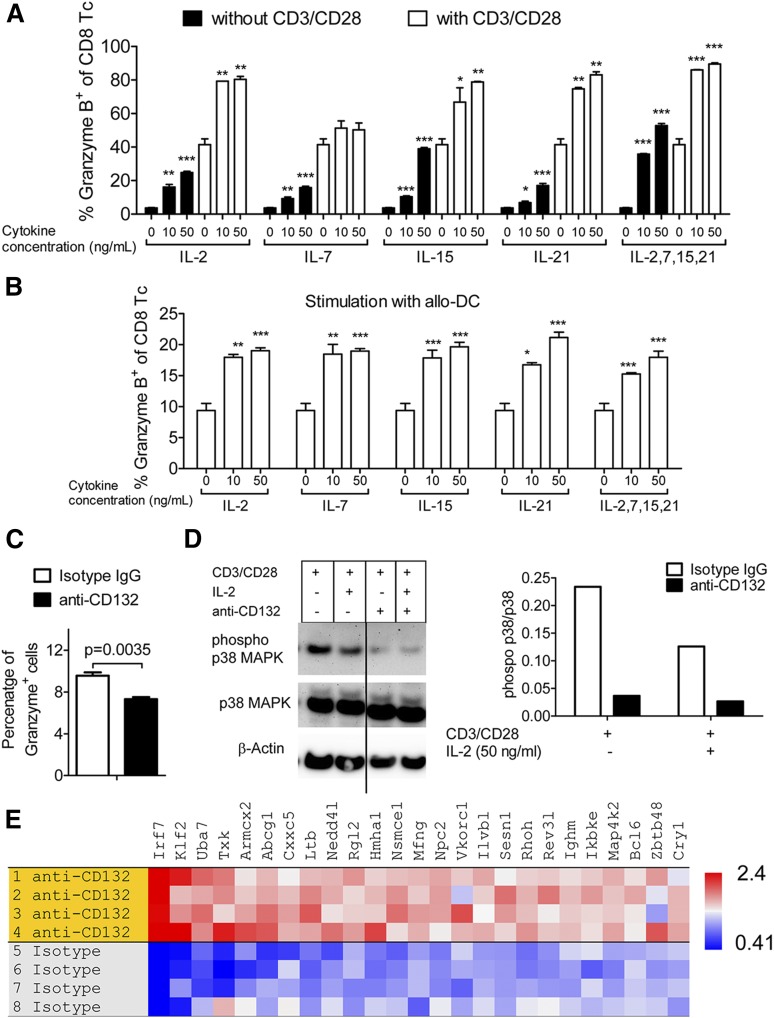
Granzyme B is induced by common γ-chain cytokines. (A) CD8 T cells were incubated with the indicated cytokines and stimulated with anti-CD3/CD28 beads for 48 hours. Cells were stained against intracellular granzyme B and analyzed by flow cytometry. One representative of 3 experiments is shown. Stimulation with CD3/CD28 beads led to a significant increase of granzyme B levels compared with the respective sample without CD3/CD28 stimulation (P < .05 in all cases). The granzyme B levels increased over baseline with a stimulation with 10 ng/mL or 50 ng/mL of any of the applied cytokines (**P < .01). (B) CD8 T cells were incubated with the indicated cytokines and stimulated with allogeneic DCs for 48 hours. Cells were stained against intracellular granzyme B and analyzed by flow cytometry. One representative of 3 experiments is shown. Stimulation with the allo-DCs led to increased granzyme B production independent of the cytokines (P < .05 in all cases). The granzyme B levels increased over baseline with a stimulation of 10 ng/mL or 50 ng/mL of any of the applied cytokines (*P < .05, **P < .01, ***P < .001). (C) T cells were incubated for 48 hours with IL-21 (10 ng/mL), anti-CD3/CD28 beads and anti-CD132 (100 nM), or isotype IgG when indicated. Cells were stained against intracellular granzyme B and analyzed by flow cytometry. (D) Western blot analysis is shown for phospho-p38 MAPK (pp38), total p38 MAPK, and β-actin on the protein derived from splenic CD4 and CD8 T cells (C57BL/6) and enriched by magnetic-activated cell sorting (MACS) which had been exposed for 48 hours to CD3/CD28 beads, IL-2 (50 ng/mL), and anti-CD132 (100 nM) when indicated. Left panel, One representative western blot is shown; right panel, quantification of the phospho-p38 MAPK (pp38)/total p38 MAPK ratio is shown. (E) Microarray-based gene expression analysis was performed on the RNA isolated from T cells following CD3/CD28 and IL-2 stimulation and treatment with anti-CD132 mAb or isotype IgG. GSEA identified a naive T-cell signature in cells receiving anti-CD132 mAb (normalized enrichment score = 1.73; nominal P value < .001). Genes upregulated in the anti-CD132 group with respect to the isotype have a high enrichment ratio (red).

