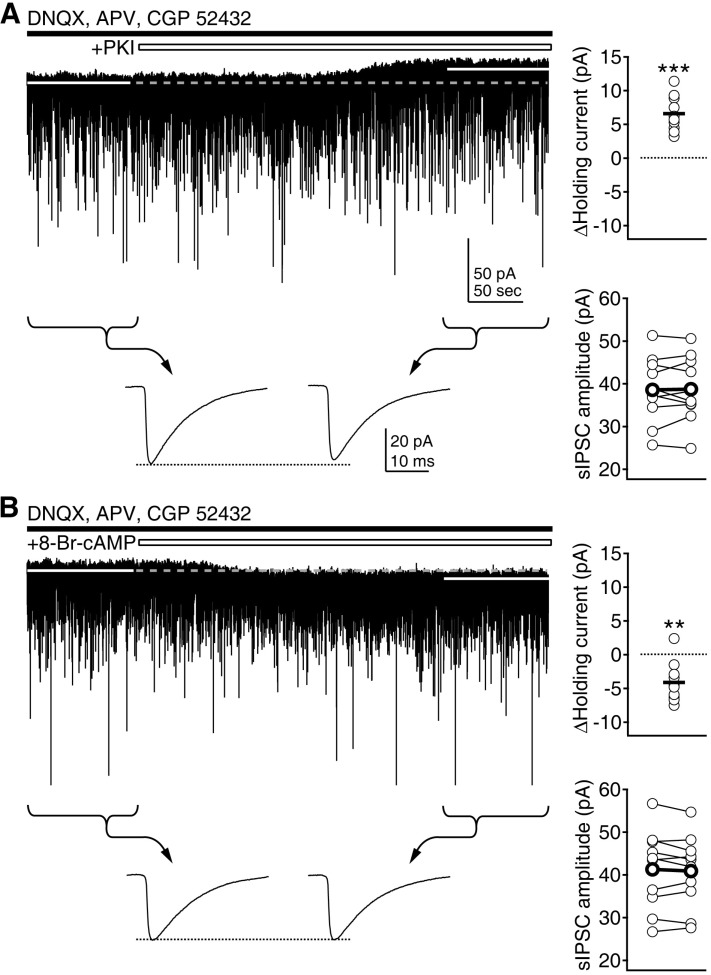
Fig. 4.
Regulation of tonic inhibition by PKA. (A) Cell-permeable myristoylated PKI (1 µM) was applied during the continuous recording of currents. Changes in holding currents and the amplitude of sIPSCs were investigated. Left upper panel shows a representative trace of current recording. Average amplitude of sIPSCs for 100 sec period before and after the application of drug was compared (indicated by braces and arrows in lower traces, showing averaged sIPSCs at the indicated period). Right panels plot individual data (symbols and thin symbols linked by lines) and averages (thick solid lines and thick symbols linked by lines). ***p<0.001 vs. baseline. (B) 8-Br-cAMP (10 µM) was applied during the continuous recording of currents. **p<0.01 vs. baseline.

