Figure 1.

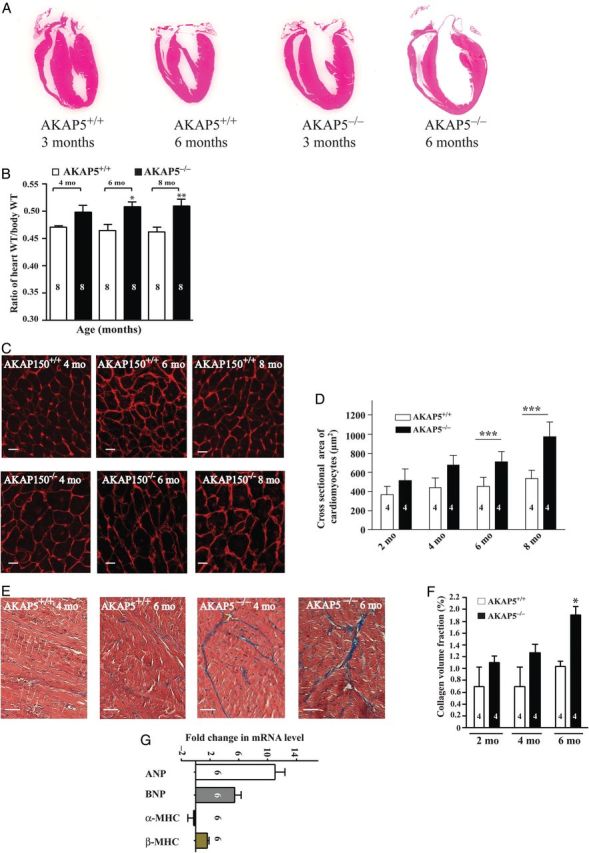
AKAP5−/− mice display a hypertrophic phenotype. (A) Histological sections of WT or AKAP5−/− hearts from 3- or 6-month-old mice. (B) Means ± SE of heart-to-body weight ratios between WT and AKAP5−/− mice at 4, 6, and 8 months of age. (C and D) Cell membrane staining (wheat germ agglutinin) and quantification of cross-sectional areas of heart cells from 4-, 6-, or 8-month-old WT and AKAP5−/− mice. Scale bars represent 25 µm. (E and F) Trichrome staining (fibrosis in blue) and quantification of fibrosis between 4- and 6-month-old WT and AKAP5−/− mice. Scale bars represent 20 µm. (G) RT-PCR analysis of hypertrophic marker gene expression in WT vs. AKAP5−/− mice at 4 months of age. Data were plotted as means ± SE. *P < 0.05, **P < 0.01, and ***P < 0.001 for either base in WT vs. base in knockout (KO) mice.
