Figure 4.

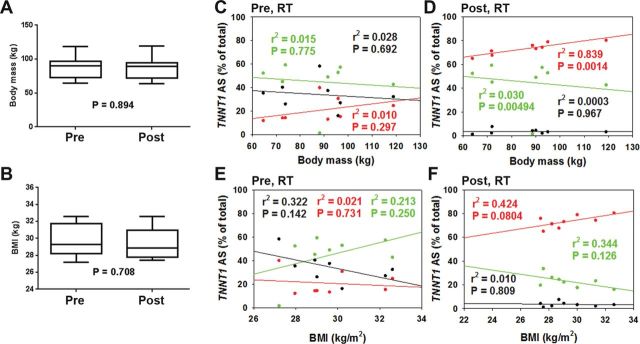
Relationships of troponin T (TNNT1) splice forms with body mass measures. Body mass (A) and body mass index (BMI; B) did not change significantly with resistance training (RT). TNNT1 alternative splicing 1 (AS1) correlated positively, and TNNT1 AS2 correlated negatively, with body mass (pre-RT, r = .422, −.121, and −.167; post-RT, r = .916, −.870, and −.0175 for AS1, AS2, and AS3, respectively) (C and D), and BMI (pre-RT, r = −.146, .462, and −.568; post-RT, r = .651, −.587, and −.102 for AS1, AS2, and AS3, respectively) (E and F). AS1: red, AS2: green, AS3: black.
