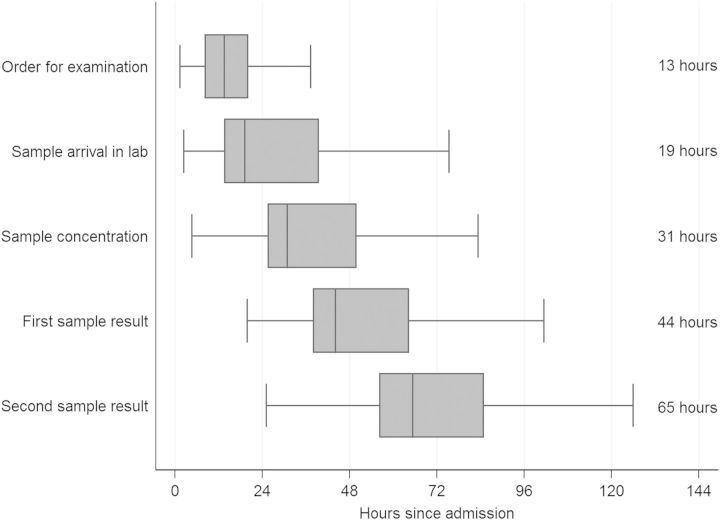
Figure 2.
Horizontal boxplots showing distributions of completion times for each step in sputum examination by concentrated acid-fast bacilli smear microscopy for all inpatient evaluation episodes (n = 142). Horizontal boxplots show medians and interquartile ranges (IQRs), with whisker plots displaying lower and upper adjacent values (values inside 1.5 × IQR). In addition, the median values are provided as text at the right side of the plot. Three patients were admitted twice, giving 139 patients and 142 observations.

