
Fig. 5.
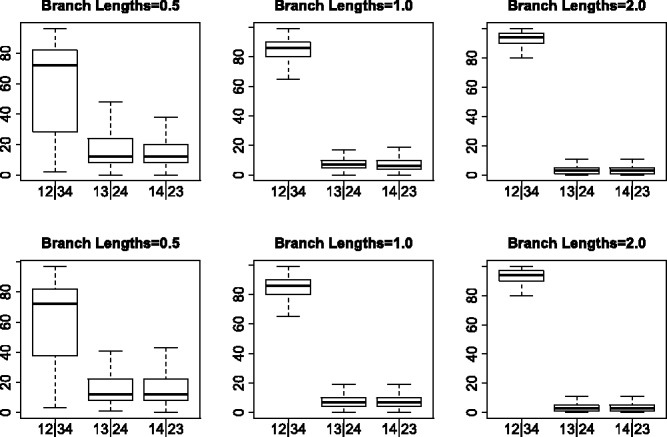
Bootstrap results for the GTR + I + Γ simulations. Each boxplot shows the distribution of the bootstrap support values for each of the three possible splits for the simulated data shown in Figure 3
Official websites use .gov
A
.gov website belongs to an official
government organization in the United States.
Secure .gov websites use HTTPS
A lock (
) or https:// means you've safely
connected to the .gov website. Share sensitive
information only on official, secure websites.
Bootstrap results for the GTR + I + Γ simulations. Each boxplot shows the distribution of the bootstrap support values for each of the three possible splits for the simulated data shown in Figure 3