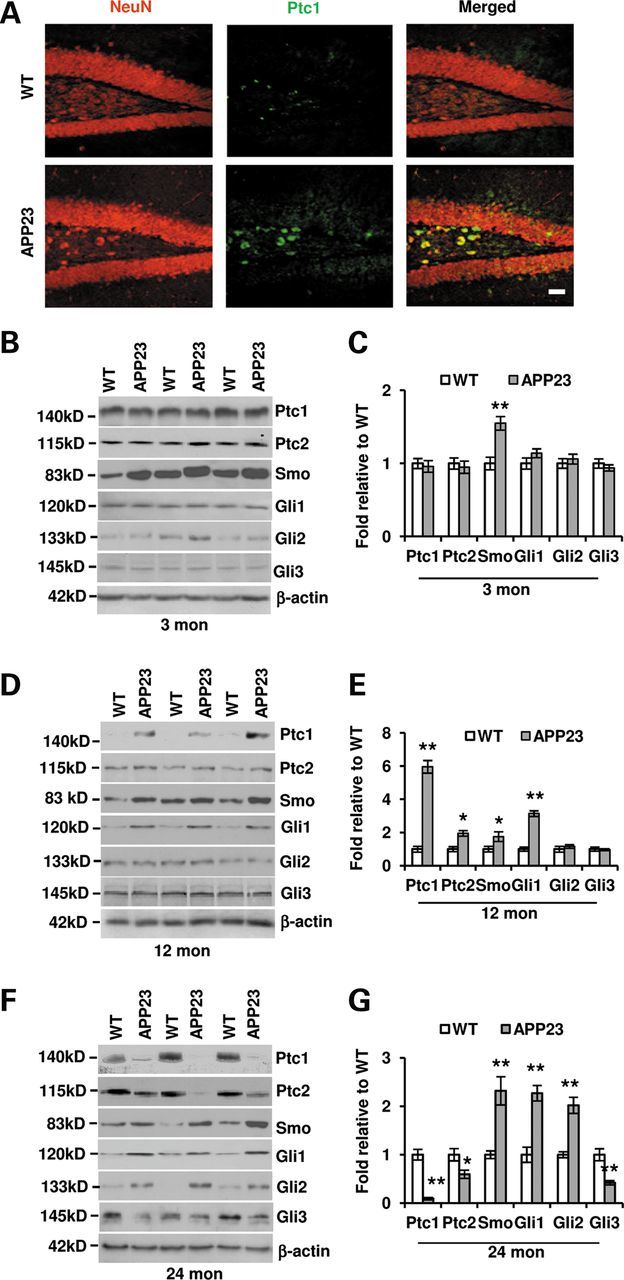
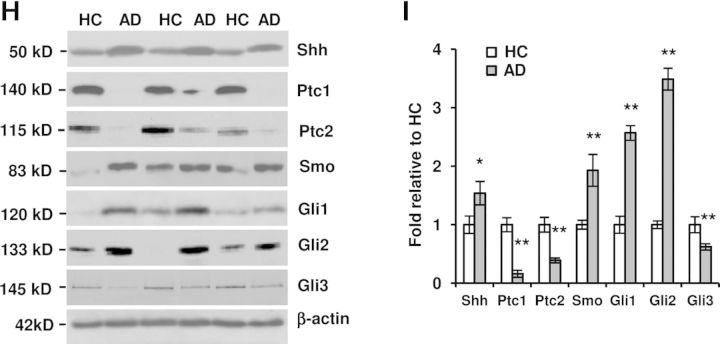
Figure 2.

Shh signal components are altered in the hippocampus of both APP23 mice and AD patients. (A) Ptc1 expression (green) was visualized by immunostaining in the dentate gyrus with an increased Ptc1 expression in 12-month-old APP23 mice, especially in the cells of hilus region. Neurons were stained with red. Scale bar: 50 µm. (B) Western blot showed the protein expressions of Shh signaling components in the hippocampus of 3-month-old APP23 mice. (C) Statistical analysis showed that the Smo expression level is increased (n = 10, Student's t-test, **P < 0.01) in APP23 mice of 3 months old of age, whereas the levels of Ptc1, Ptc2, Gli1, Gli2 and Gli3 expressions were still not significantly changed. (D) Western blot showed the protein expressions of Shh signaling components in the hippocampus of 12-month-old APP23 mice. (E) Statistical analysis showed that the expression levels of Ptc1, Ptc2, Smo and Gli1 were increased (n = 10, Student's t-test, *P < 0.05, **P < 0.01 versus corresponding WT) in APP23 mice of 12 months old of age, whereas the levels of Gli2 and Gli3 expressions were not significantly changed. (F) Western blot showed the protein expressions of Shh signaling components in the hippocampus of 24-month-old APP23 mice. (G) Statistical analysis showed that the expression levels of Smo, Gli1 and Gli2 are increased (n = 10, Student's t-test, *P < 0.01 versus corresponding WT) in APP23 mice of 24 months old of age, whereas the levels of Ptc1, Ptc2 and Gli3 expressions were significantly reduced (n = 10, Student's t-test, *P < 0.05, **P < 0.01 versus corresponding WT). (H) Western blot showed that Shh signaling components were expressed in the hippocampus of isolated from human brains of HC and AD patients. (I) The protein levels of Shh, Smo, Gli1 and Gli2 expression were significantly increased, whereas the expression levels of Ptc1, Ptc2 and Gli3 were significantly reduced in comparison with corresponding health controls without dementia (n = 5, Student's t-test, *P < 0.05, **P < 0.01 versus HC).

