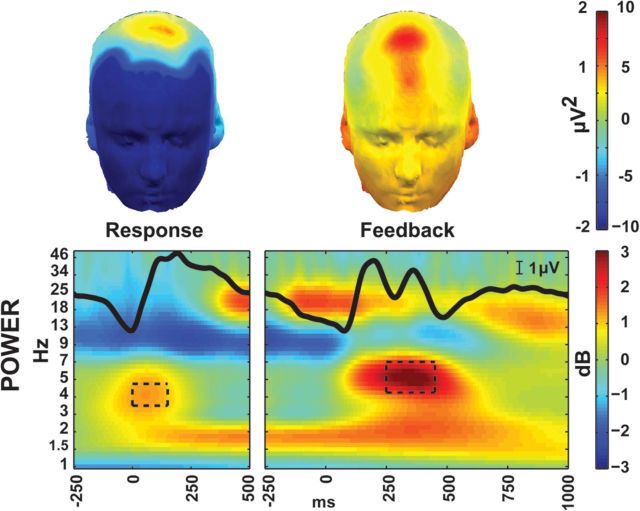
Figure 3.
Event-related EEG at the FCz electrode to response and feedback. Positive amplitude is displayed up on the y-axis. The ERP is superimposed over the power plots in black. TF-ROIs are shown in the black boxes. Topomaps are taken from the TF-ROIs shown here (±10 μV2 for feedback, ±2 μV2 for response).

