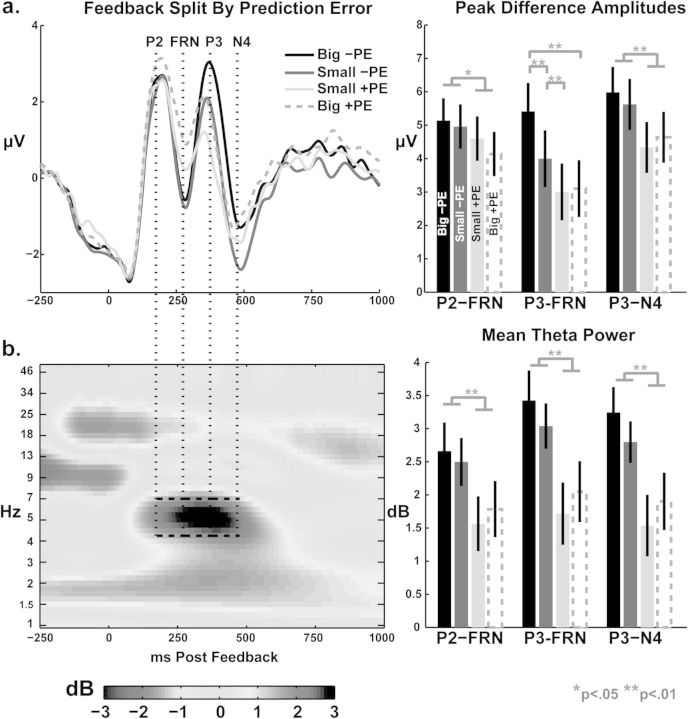
Figure 6.
Feedback-locked ERP (a) and total theta power (b) from the FCz electrode, split by sign and magnitude of prediction error. Bar graphs display mean values (±SEM) taken from the time windows indicated by vertical dashed lines. For both EEG measurements, there was a strong and reliable effect for sign (negative > positive prediction error).

