
Figure 7.
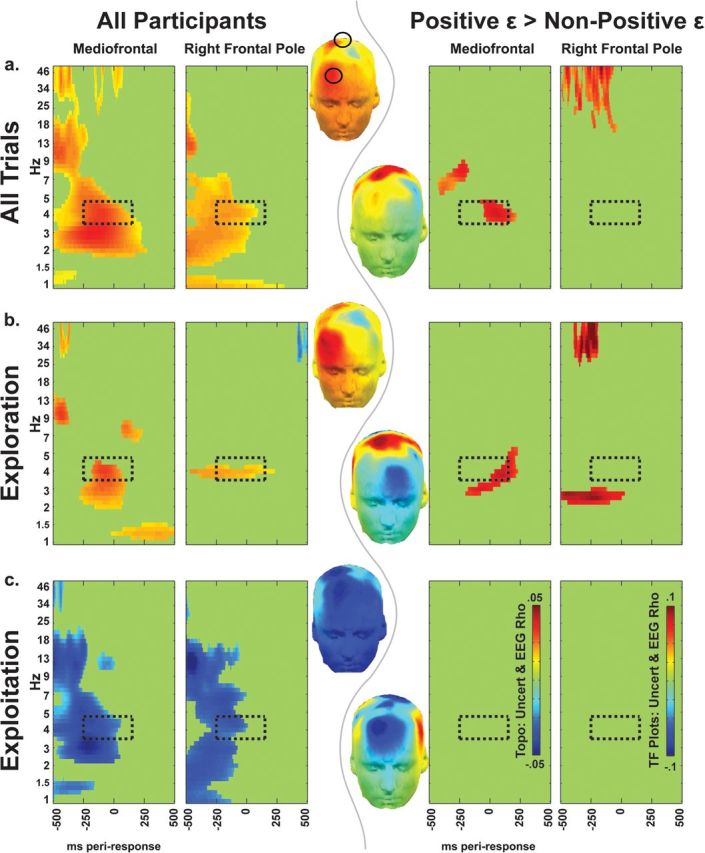
Nonparametric correlations (ρ values) between relative uncertainty (chosen–unchosen option) and EEG power at the time of the response, for all subjects (left columns) and positive ϵ > nonpositive ϵ groups (right columns). Topographic plots show EEG–uncertainty correlations in the extended TF-ROI (leftward topoplots are all subjects, rightward topoplots are positive ϵ > nonpositive ϵ). Mid-frontal and right frontopolar sites are indicated on the top topoplot. (a) Total relative uncertainty is characterized by a positive relationship with medial beta power and medial and frontopolar theta power. (b) When participants selected the response with greater uncertainty, similar patterns emerged: frontopolar theta and mid-frontal theta correlated with relative uncertainty. This specific effect was larger in subjects that the model identified as using uncertainty to guide exploration (positive ϵ). (c) In stark contrast, when participants selected the option with the lower relative uncertainty, there were widespread negative correlations between relative uncertainty and medio/lateral/frontal beta and theta power and no difference between ϵ groups.