
Figure 4.
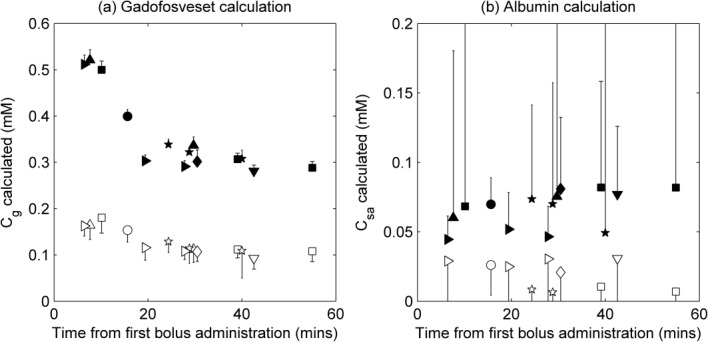
Calculated gadofosveset (a) and albumin (b) concentrations in myocardium (open symbols) and left ventricle (filled symbols) in healthy volunteers at 3.0T. Each symbol shape represents a different volunteer; values are plotted against time from first administration of contrast agent (to mid-point between T1 and T2 image acquisition times); error bars indicate uncertainty in calculations, calculated by propagation of errors using standard deviation of initial R1 and R2 ROI measurements (errors are symmetrical about data point, but only one side shown to aid clarity)