Figure 1.

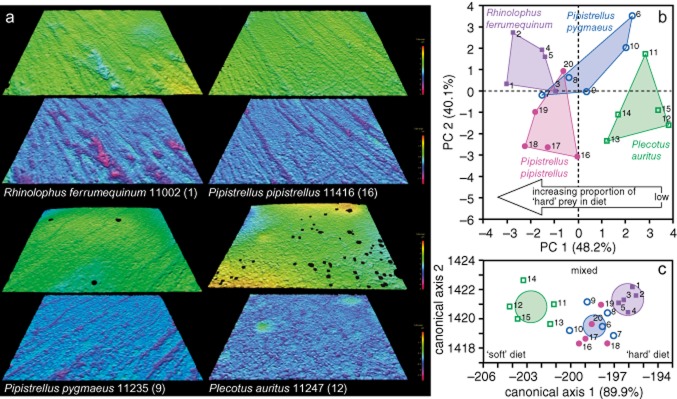
Tooth microwear textures of bats, and multivariate analysis of International Organization for Standardization (ISO) roughness parameters. (a) Digital elevation models showing levelled surface data (above) and scale-limited roughness surfaces (below) for the four species of bats. See text for details of data processing; numbers in brackets identify specimens in (b) and (c). Measured areas are 146-μm wide. (b) Principal components (PC) analysis of ISO roughness parameters that differ between species. Species form largely non-overlapping clusters; PC axis 1 correlates with dietary differences between species. For details of loadings (eigenvectors) of roughness parameters onto PC axes 1 and 2 see Supporting Information Table S3. (c) Linear discriminant analysis of ISO roughness parameters that differ between species. Analysis correctly assigns all specimens to one of three trophic groups (groups based on the amount of ‘hard’ prey consumed; probability of correct assignment >0.9 for all but one Pipistrellus pygmaeus (0.64) and one Pipistrellus pipistrellus (0.63); Wilks’ Lambda = 0.07; F = 2.72; P = 0.02). Canonical axis 1 correlates with dietary differences between species. Ellipses show 95% confidence limits for means.
