
Figure 1. Generation and characterization of Arpc2−/− fibroblast cell lines.
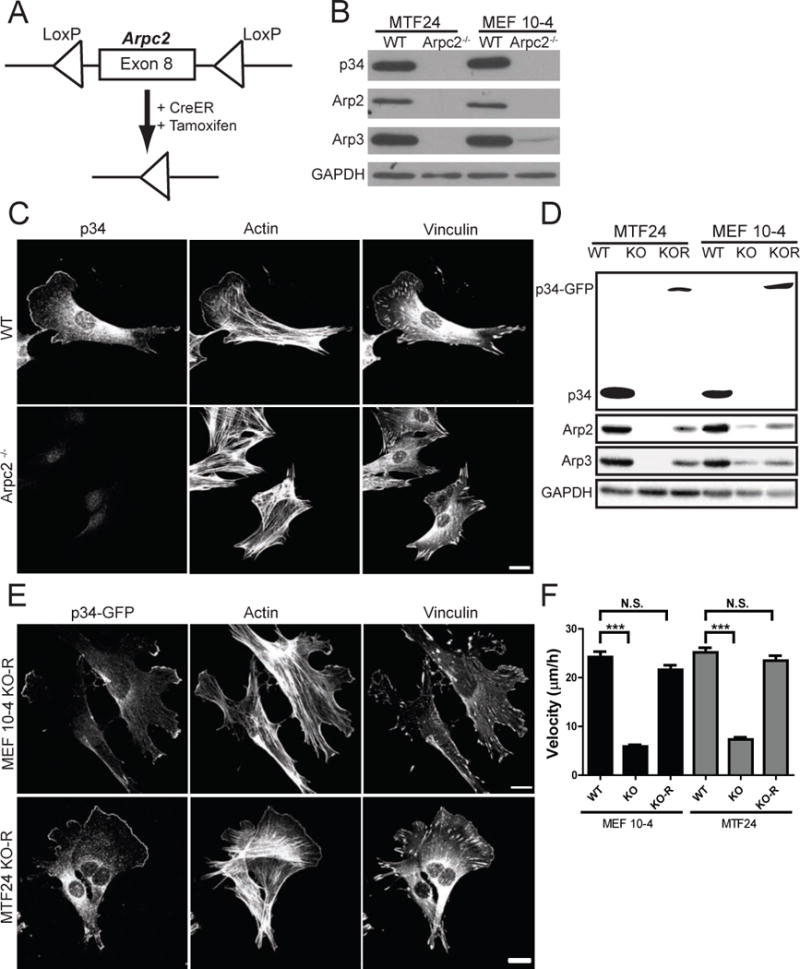
A) Schematic representation of tamoxifen-inducible CreER activation and Arpc2 (p34) deletion. B) Blot analysis of two mouse fibroblast cell lines without (WT) or with (Arpc2−/−) tamoxifen treatment. C) Staining of MTF24 WT and Arpc2−/− fibroblasts; scale bar = 20 microns. D) Blot analysis of cell lines without (WT), with (KO) tamoxifen treatment, or KO cells stably rescued with p34-GFP (KO-R). E) Staining of MEF 10-4 KO-R and MTF24 KO-R fibroblasts; GFP indicates p34-GFP; scale bars = 20 microns. F) Random migration velocity of WT, KO, and KO-R MEF 10-4 (black bars) and MTF24 (grey bars) fibroblasts; N = at least 54 cells per condition; error bars represent standard error of the mean; ***p-value < 0.0001. See also Figure S1.