
Figure 4. Profilin inhibits Arp2/3 complex actin nucleation, disrupts Arp2/3 complex leading edge localization and impedes lamellipodia generation.
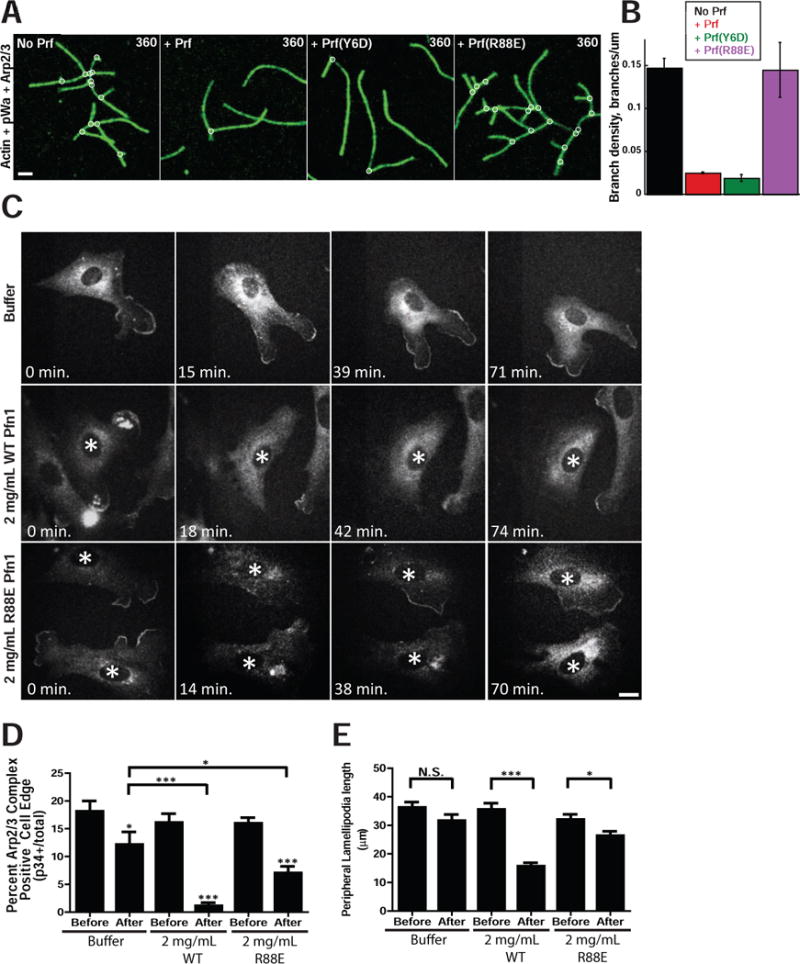
A) Time-lapse TIRF microscopy of 1.5 μM Oregon green-labeled actin polymerized in the presence of 40 nM Arp2/3 complex, 150 nM pWA in the absence (No Prf) or presence of either 5 μM WT (+ Prf), Y6D, or R88E hProfilin-1. Scale bar = 2 microns. B) Effect of WT, Y6D or R88E hProfilin-1 on branch density, quantified from time-lapse TIRF experiments in A. Plotted as mean plus SEM. C) Representative images of p34-GFP localization before (0 min) and at various times after microinjection of buffer, 2 mg/mL WT hProfilin-1, or 2 mg/mL R88E hProfilin-1. Scale bar = 20 microns. Asterisks denote microinjected cells in images with multiple cells. D) Percent of p34-GFP positive edge. Quantified as positive edge/total edge × 100% based on measurements done by hand in ImageJ. Measurements were made before and directly after microinjection for each condition, plotted as mean with SEM. N = at least 31 cells per condition. ***p-value < 0.0001, *p-value < 0.05; p-values for each post-injection mean are to pre-injected cells of same condition, unless explicitly noted otherwise. E) Peripheral lamellipodia length. The length of p34-GFP positive edge was determined by outlining the periphery of each protrusion in ImageJ to yield the peripheral length in microns, plotted as mean with SEM. N = at least 66 lamellipodia in pre-injection for each condition; N = 67 for buffer post-injection, 58 for R88E post-injection and 11 for WT post-injection. ***p-value = 0.0006, *p-value = 0.0426. See also Figure S3.