
Figure 5. Profilin affects overall F-actin structure in cells with functional Arp2/3 complex.
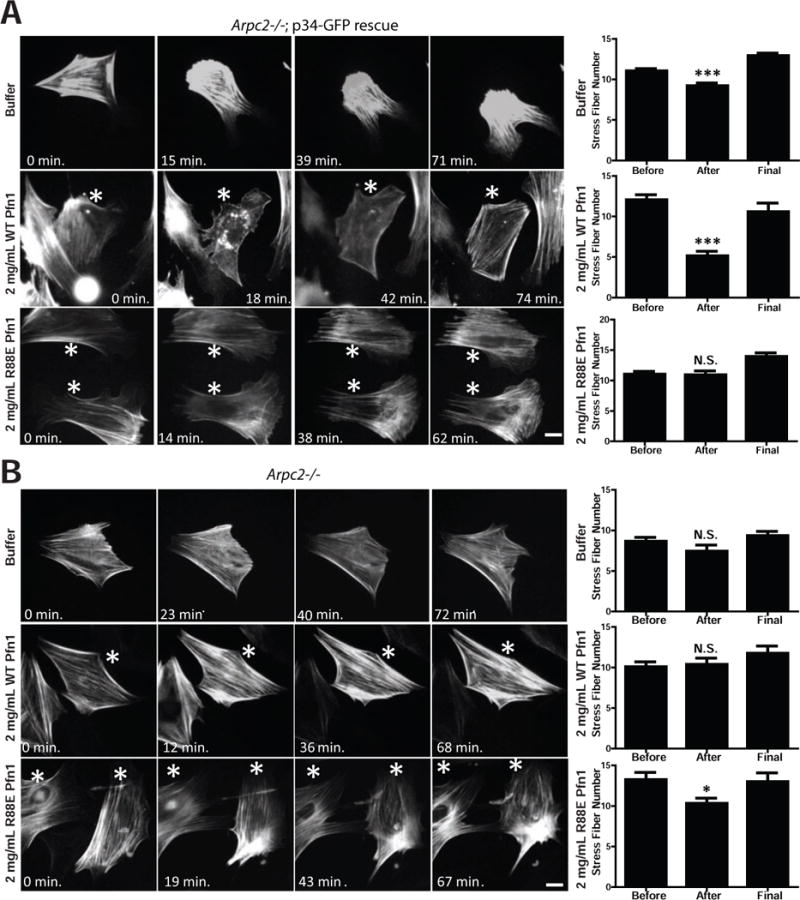
A) Representative images of Lifeact-RFP labeling in p34 knockout-rescue cells (Arpc2−/−; p34-GFP rescue) before (0 min.) and at various times after microinjection of buffer, 2 mg/mL WT hProfilin-1, or 2 mg/mL R88E hProfilin-1. Scale bar = 20 microns. Asterisks denote microinjected cells in images with multiple cells. Right: Quantification of stress fiber number from images before, after and at the end (‘final’) of the post-injection time course. Counted as number of stress fibers across a line drawn perpendicular to the predominant stress fiber orientation, plotted as mean with SEM; N = 198 measurements from 66 buffer-injected cells, 78 measurements from 26 WT hProfilin-1 injected cells, 60 measurements from 20 R88E hProfilin-1 injected cells. ***p-value < 0.0001. B) Representative images of Lifeact-RFP labeling in Arpc2−/− cells before (0 min.) and at various times after microinjection of buffer, 2 mg/mL WT hProfilin-1, or 2 mg/mL R88E hProfilin-1. Scale bar = 20 microns. Asterisks denote microinjected cells in images with multiple cells. Right: Quantification of stress fiber number, plotted as mean with SEM; N = 36 measurements from 12 buffer-injected cells, 60 measurements from 20 WT hProfilin-1 injected cells, or 42 measurements from 14 R88E hProfilin-1 injected cells. *p-value = 0.0103. See also Figure S3.