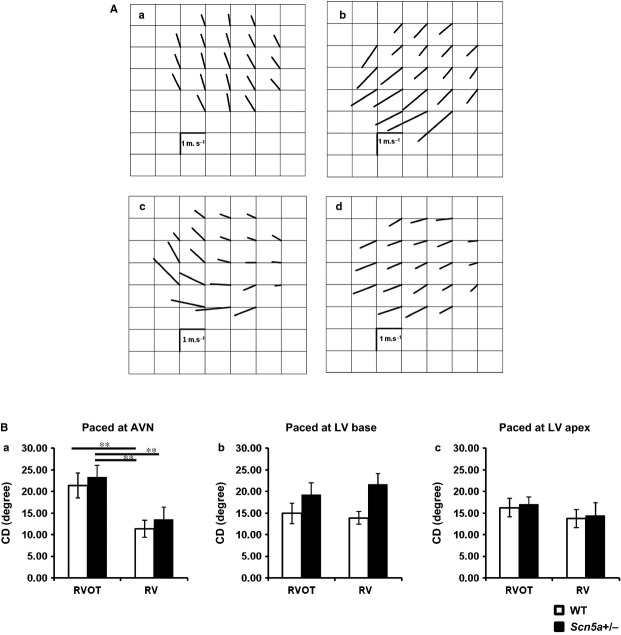
Figure 5.
(A) Mappings of conduction directions from recordings made at the free walls of the right ventricular outflow tract (RVOT) and right ventricle (RV) of WT and Scn5a+/− hearts. Typical findings from WT (a, b) and Scn5a+/− (c, d) with recording from RVOT (a, c) and RV (b, d). (B) Determinations of the dispersion (CD) in conduction direction at the RVOT (left pair of histograms) and RV (right pair of histograms) for both WT (clear bars) and Scn5a+/− hearts (filled bars) sorted by the atrioventricular node (AVN) (a), LV base (b) and LV apex (c) pacing sites. CD: dispersion in conduction direction. With AVN pacing (Ba), the Scn5a+/− RVOT showed greater dispersions than either the RV of the WT (P < 0.01) or the RV of the Scn5a+/− (P < 0.01). Similarly, the WT RVOT showed greater dispersions than the WT RV (P < 0.01) (Ba). **P < 0.01.

